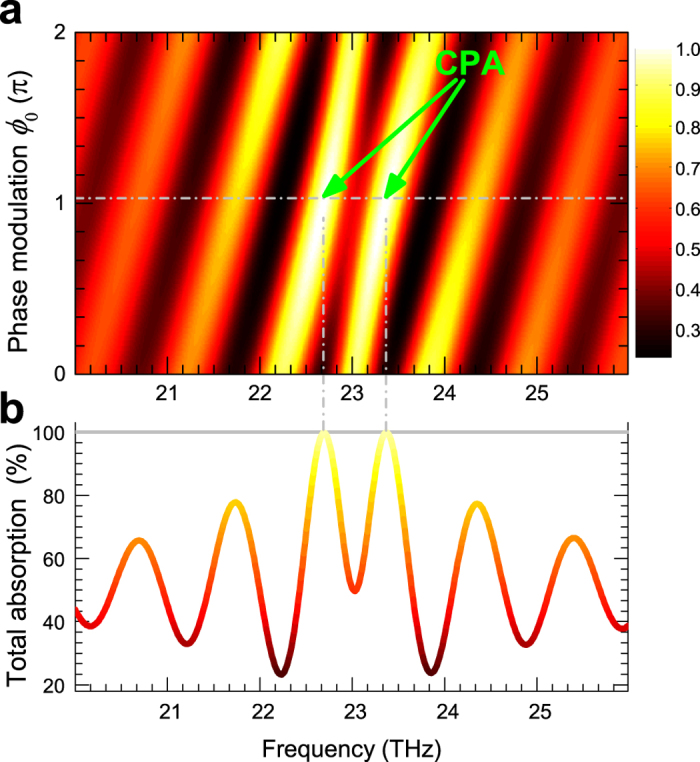
Figure 3. A two-dimensional false-color plot of the normalized total absorptions as a function of frequency and phase modulation ϕ0, the exact CPA points are denoted with green arrows.

(b) Normalized total absorption as a function of frequency for the phase modulation ϕ0 = 1.03π.
