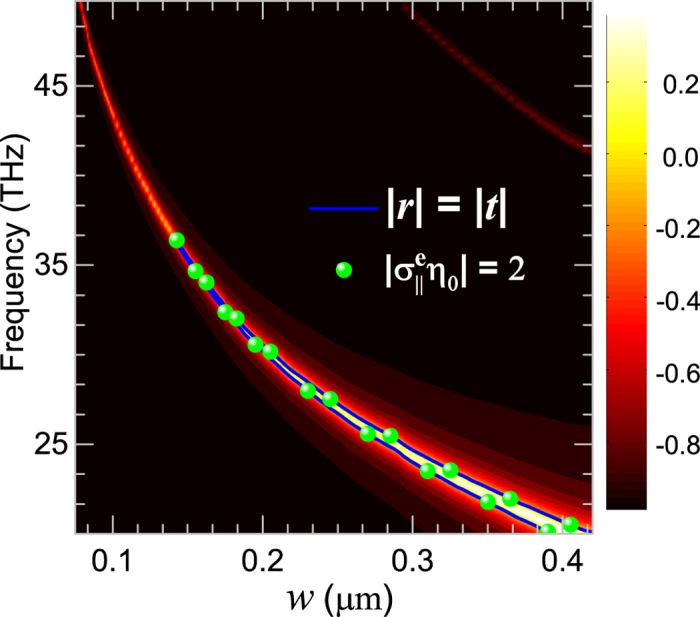
Figure 4. Geometric tunability of the graphene meta-surface CPA: Spectra of the difference  of the scattering coefficients (r and t) for the graphene meta-surface width increasing from 0.075 μm to 0.42 μm.

The solid line indicates quasi-CPA points where  , while the spheres represent the extracted surface conductivities with values
  .
.
