
Figure 4. Diffusion rate and inhibitory effect of peptide injection.
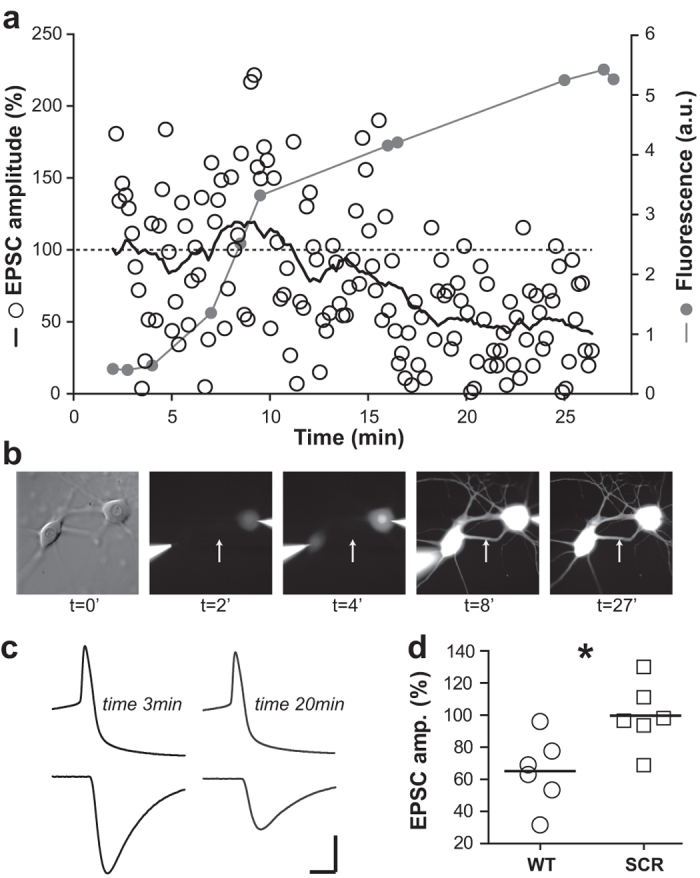
(a) Normalized EPSC amplitude monitored over time for the pair of neurons shown in b. Empty circles represent the amplitude of single EPSCs and the black line the smoothed running average (every two minutes) of these values. The dashed line represents the base line level (100%) of EPSC amplitude. Grey lines and circles represent the level of fluorescence measured over time on cell processes. Note that the intensity of this signal reaches approximatively half of its maximal value around 8–10 minutes exactly when the amplitude of the EPSC starts to decrease. (b) Photomicrographs of the recorded pair of neurons corresponding to the data shown in (a). Note the progressive increase of fluorescence intensity in the soma (t = 4′) and then in neurites (t = 8′ and 27′). The white arrow represents the position where the intensity of fluorescence illustrated in (a) was measured. (c) Pre- and post-synaptic signals at fast time-scale, before (3 min) and during L3.4 peptide injection (20 min). Scale bars are 4 ms, 40 pA, 40 mV. Note the decrease of EPSC amplitude while the AP shape is not affected by the peptide. An average of 6 traces is illustrated for each time. (d) Normalized EPSC amplitudes ± s.e.m. at 20–25 min in the presence of L3.4 peptide (WT) 65.2 +/− 8.9% or its scrambled form (SCR) 99.8 +/− 8.3 ; *P = 0.026 (Mann-Whitney U test). The horizontal bars represent the mean for each group.