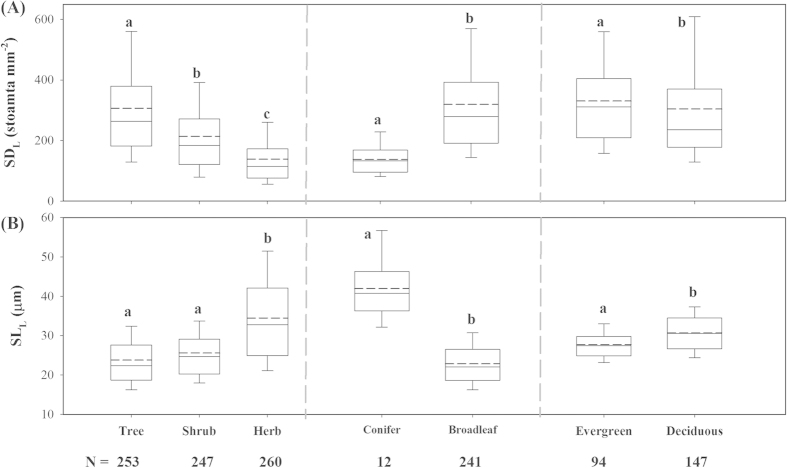
Figure 3. Box plots of stomatal density (SDL, (A)) and stomatal length (SLL, (B)) across different plant functional types (PFTs).
The solid and dashed lines across the middle of the box are mean and median values, respectively. N, species number. Statistical differences (P < 0.05) are denoted by different letters using one-way analysis of variance (ANOVA).

