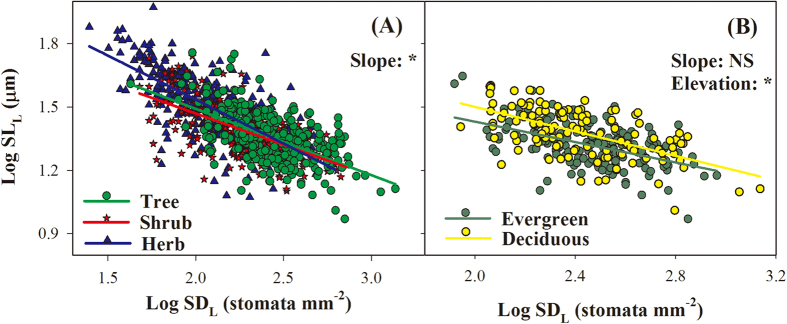
Figure 5.

Standardized major axis (SMA) regressions between species-level stomatal density (SDL) and stomatal length (SLL) across different growth types (A) and leaf habits (B). “Slope”, difference in SMA slopes; “Elevation”, difference in SMA elevations (i.e. y-axis intercept); *significantly different (P < 0.05); NS, not significantly different (P > 0.05). Sample size and results of regression analyses are presented in Supplementary Table S3.
