
Figure 2. Representative plots for Community Structure (Ci) Vs protein node numbers were plotted in this figure for 1st (a) and 2nd (b) order interactomes.
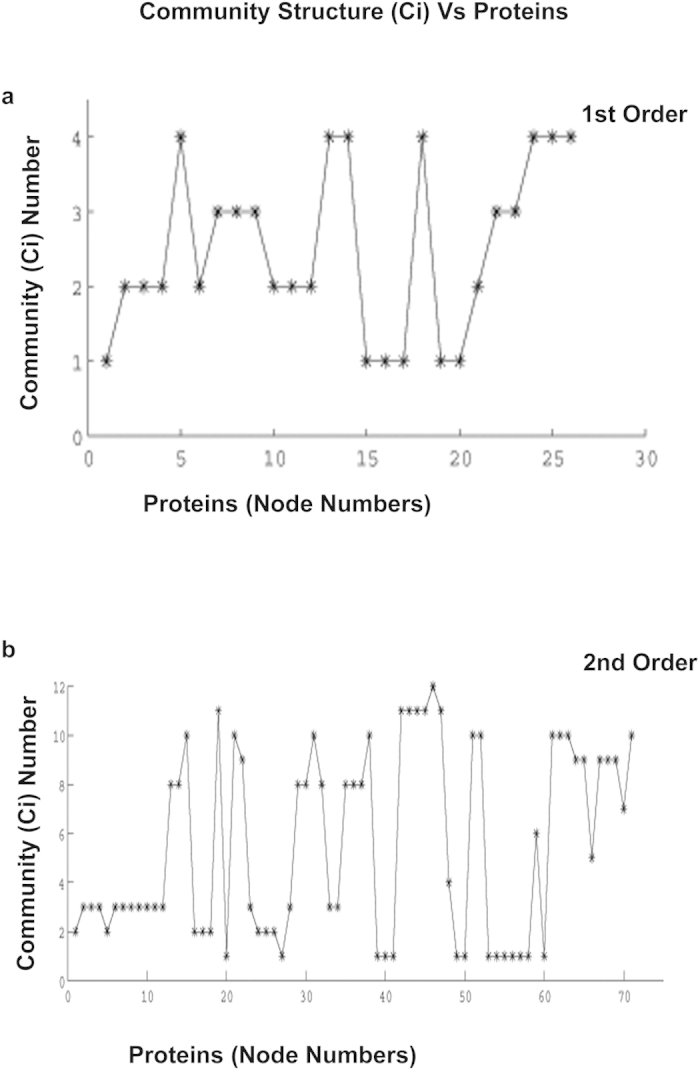
The Ci value from each analysis was obtained from running the codes for 50 times. Thereafter the mean Ci values corresponding to the mean Modularity score (Q) for each protein was plotted against the corresponding protein node number.