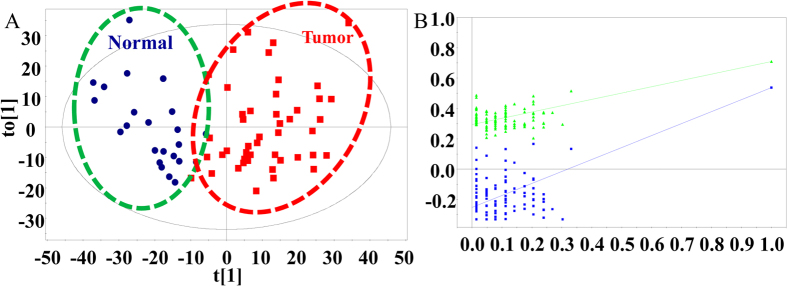
Figure 2.

(A) Score plot of the OPLS-DA models (R2(Y) = 71.0% and Q2 = 57.3%) derived from AFADESI-MSI data to differentiate lung cancer tissue (Red squares) and adjacent normal tissue (Blue circles). Sample points for different histopathological classes are grouped and clearly separated from one another. (B) Permutation test results (after 100 permutations) of the PLS-DA models (R2 = 0.294, Q2 = −0.253) correspond to the OPLS-DA models, indicating that the model was not overfitted and can be further processed.
