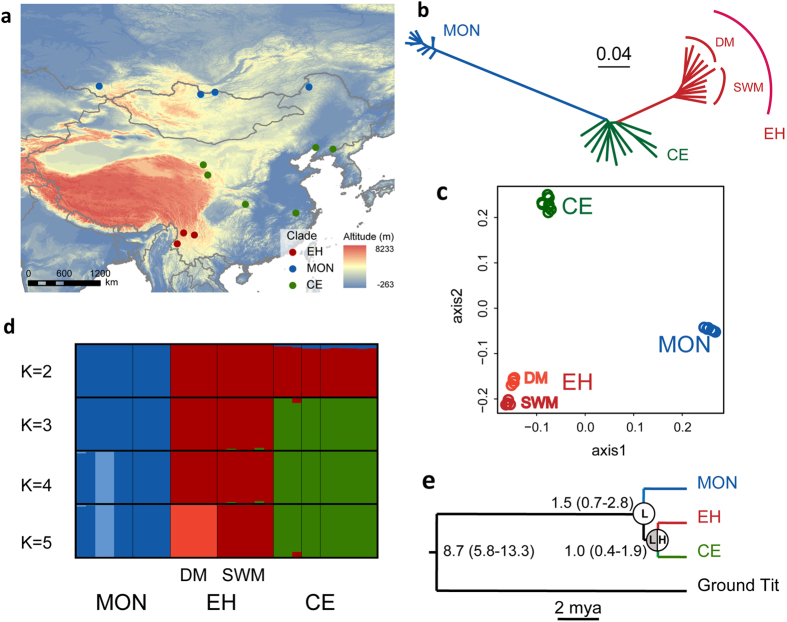
Figure 1. Sampling sites and population genetic structure of the great tit (Parus major), red dots indicated individuals belong to the eastern Himalayas group (EH); green dots indicated the Central/East China group (CE); and blue dots indicated the Mongolian group (MON).
(a) great tit samples from the eastern Himalayas, Central/East China and Mongolia (ArcGIS 9.3, ESRI). (b) neighbour-joining tree based on genome-wide SNPs data computed in PHYLIP 3.695. The eastern Himalayas group consisted of individuals from the Diannan Mountains Subregion (DM) and South-West Mountains Subregion (SWM), respectively. (c) principal component analysis (PCA) of great tit implemented in GCTA37. The plot was based on the first two principal components that explained 43% of the overall variation. (d) analysis result of the genetic structure computed in FRAPPE 1.138. The colors in each column represented ancestry proportion over a range of population clusters K2-5. (e) phylogenetic tree and divergence times of the three studied groups of great tits based on 179 single-copy orthologous CDs estimated using PAML39. Ancestral areas distribution (lowland versus highland) for main internal nodes was estimated by DIVA.

