
Figure 3. Changes in bacterial production (BP) (lines) and cell-specific bacterial production (sBP = BP/BA) (vertical bars) for 4 bacterial species S1, S2, S3 and S4 in the cultures with (+v) (open circles) or without viruses (−v) (filled circles) in waters from Stns VM5 and PM7 during 3 days.
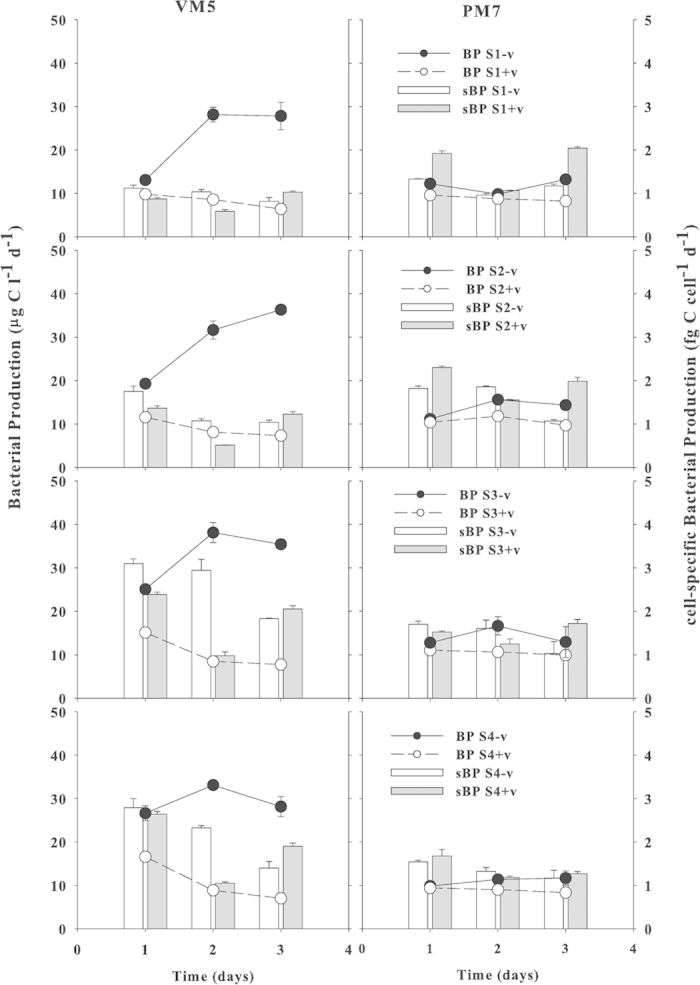
Gray and white bars are sBP with and without viruses respectively. Error bars are ± 1 SD and n = 2.