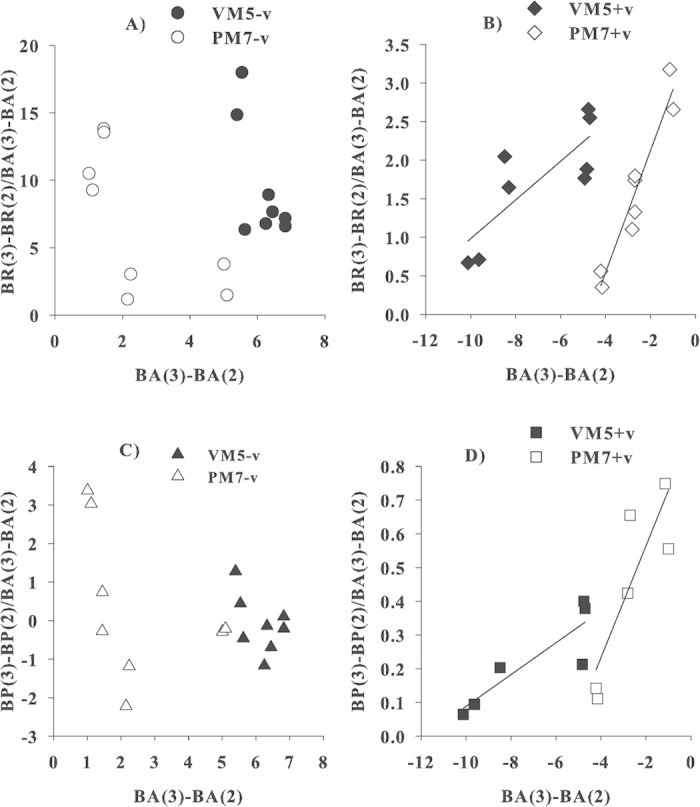
Figure 5. Correlations between changes in bacterial abundance from day 2 to 3 and the corresponding, cell specific bacterial respiration and production for VM5 and PM7.

Assuming the concentration of the dead bacterial cells was equal to ΔBA(3)–(2) using BA on day 3 minus BA on day 2, the corresponding change in BR and BP was ΔBR(3)–(2) and ΔBP(3)–(2) using BP and BR on day 3 minus day 2. (A) ΔBR without viruses (VM5, black circles; PM7, white circles), no significant linear relationships, (B) ΔBR with viruses (VM5, black diamonds; PM7, white diamonds), significant linear relationships are ΔBR = 0.25 × ΔBA + 3.49, r2 = 0.66, p < 0.05, n = 8 for VM5; ΔBR = 0.79 × ΔBA + 3.71, r2 = 0.92, p < 0.05, n = 8 for PM7, (C) ΔBP without viruses (VM5, black triangles; PM7, white triangles), no significant linear relationships, and D) ΔBP with viruses (VM5, black squares; PM7, white squares), significant linear relationships are ΔBP = 0.05 × ΔBA + 0.56, r2 = 0.77, p < 0.05, n = 6 for VM5 and ΔBR = 0.17 × ΔBA + 0.88, r2 = 0.76, p < 0.05, n = 6 for PM7.
