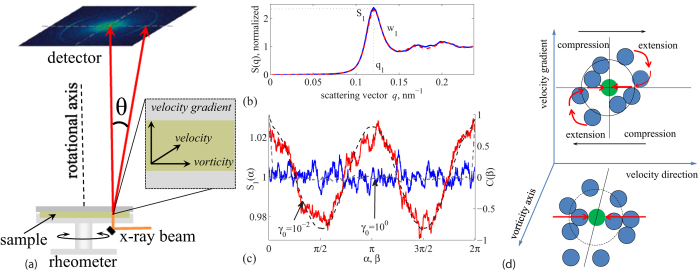
Figure 1. X-ray measurement of affine shear distortion of amorphous structure.
(a) Schematic of the experimental setup illustrating the x-ray beam path with respect to the rheometer and the layer of sheared suspension. The rheometer is stress controlled and we use plate-plate geometry. The x-ray beam passes through the suspension at 0.78 times the disc radius; the beam diameter is smaller than 0.1 mm, much smaller than the disc radius of 18 mm. The velocity, vorticity and velocity gradient directions at position of the beam is shown in the inset. (b) Angle-averaged structure factor S(q) of the colloidal glass in quiescent state (blue solid curve) and sheared state (red dashed curve). (c) Angle-dependent height of the first peak of the structure factor shows affine nearest- neighbor distortion for small (γ0 = 10−2, red curve) and no distortion for large strain amplitudes (γ0 = 100, blue curve). Corresponding angular correlation functions C(β) (black dashed lines and axis on the right) quantify the degree of affine distortion. All angles are given relative to the velocity direction. (d) Schematic of elastic shear distortion of the nearest-neighbor structure. Particles move closer to the central particle in the compression sector, and move further away in the dilation sector of the shear plane. Illustration shows projection in the velocity direction-velocity gradient plane (top) and the velocity-vorticity plane probed by x-ray diffraction (bottom).

