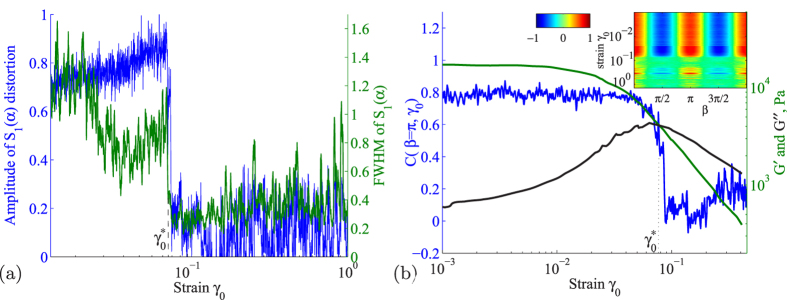
Figure 2. Sharp symmetry change of nearest-neighbor structure.

(a) Amplitude of S1(α) distortion (left axis, blue curve) and full width half maximum of S1(α) (right axis, green curve) as a function of applied strain amplitude γ0. Both quantities show sharp transition at  . The increasing amplitude of the distortion for
  indicates the growing distortion with increasing γ0. Sharp loss of distortion occurs at
  , where the two-fold symmetry vanishes, and the amplitude becomes essentially flat. (b) Order parameter C(β = π, γ0) of affine distortions shows sharp drop as a function of strain amplitude (left axis, blue). Also indicated are the elastic and viscous moduli, G′ and G′′ (right axis, green and black). Inset: Contour plot showing the evolution of the angular correlation function C(β, γ0) (see color bar) as a function of strain amplitude γ0 (vertical axis).
