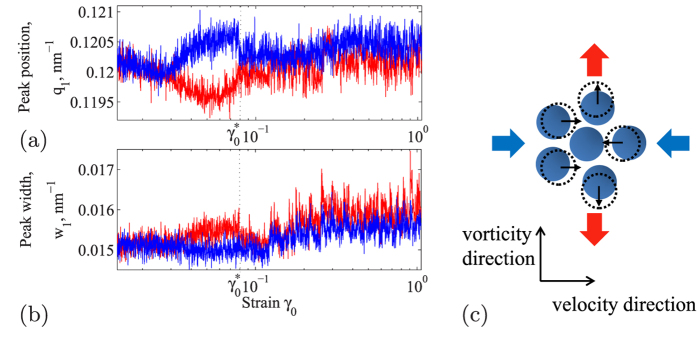
Figure 3. Distortion of nearest-neighbor structure.

(a) Position q1 of the first peak of the structure factor indicates compression along (blue) and dilation perpendicular to the velocity direction (red). (b) Peak width w1 as a function of strain. (c) Schematic illustrating the emerging distortion of the nearest-neighbor structure for  .
.
