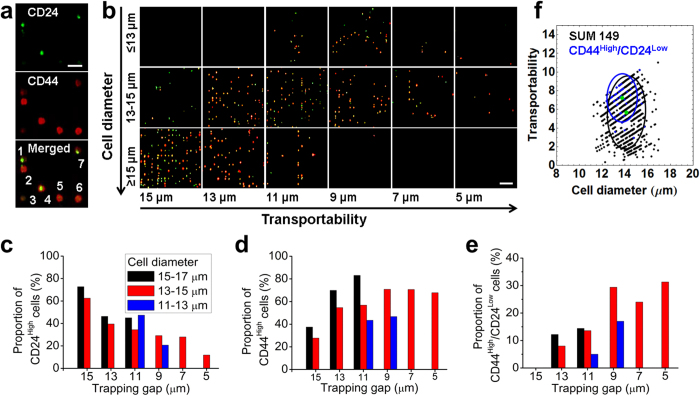
Figure 5. The relationship between CD24/CD44 expression and transportability in SUM149 cells is investigated.
(a) Immunofluorescence staining is shown for CD24 (green), CD44 (red), and the merged image. The cells labeled 1 and 7 are CD24High/CD44Low phenotypes. The cells labeled 2, 5, and 6 are CD24Low/CD44High phenotypes. The cell labeled 4 is CD24High/CD44High phenotype. The cell labeled 3 is CD24Low/CD44Low phenotype, scale bar = 50 μm. (b) Microscopic images show CD24 and CD44 staining of trapped cells of indicated diameters and transportability, scale bar = 100 μm. (c) The proportion of CD24High cells is plotted versus gap width. The proportion of cells expressing CD24 decreases with transportability. (d) The proportion of CD44High cells is plotted versus gap width. The proportion of cells expressing CD44 increases with transportability. (e) The proportion of CD24Low/CD44High cells is plotted versus gap width. The proportion of cells with phenotype CD24Low/CD44High increases with transportability. (f) Transportability versus cell diameter is plotted for CD24Low/CD44High cells and SUM 149. Blue and black circles indicate the 80% confidence interval centered at the mean depicted by a green dot.

