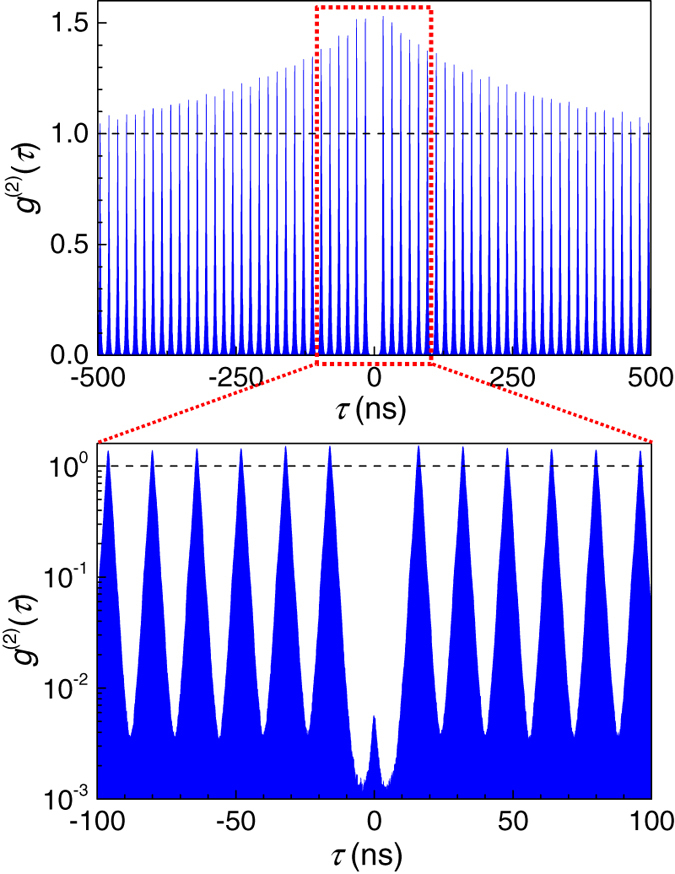
Figure 2. Photon correlation measurement.

Results of correlation measurements of emitted photons associated with this experiment; g(2)(τ) is plotted as a function of the time delay τ of the arrival time of the photons. We chose g(2)(0) = 0.0051 and  = 0.05 at the repetition rate of 62.5 MHz. The lower trace is a magnification of the central part of the upper trace around τ ~ 0, and g(2)(0) is plotted on a logarithmic scale.
