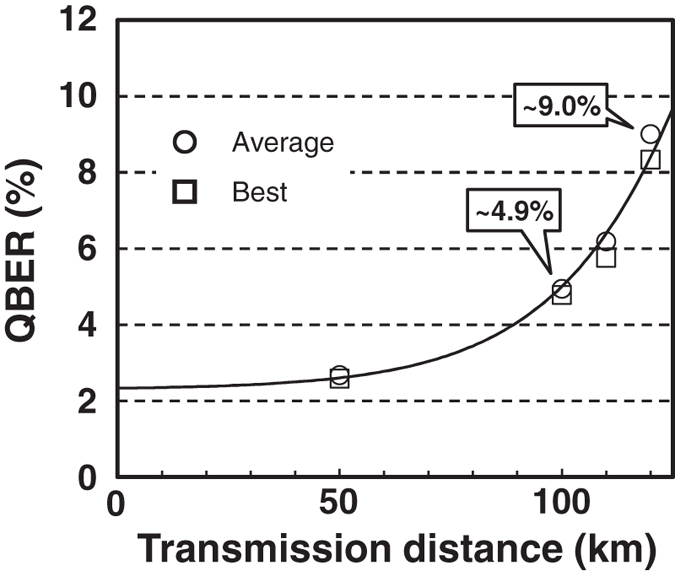
Figure 4. QBER.

Measured QBER as a function of transmission distance. Data sent through 50, 100, 110, and 120 km-long SMF spools are shown. The rectangles and circles are, respectively, the best data and the average of the top ten data during the experiment. The solid line is the fit for obtaining some of the experimental parameters.
