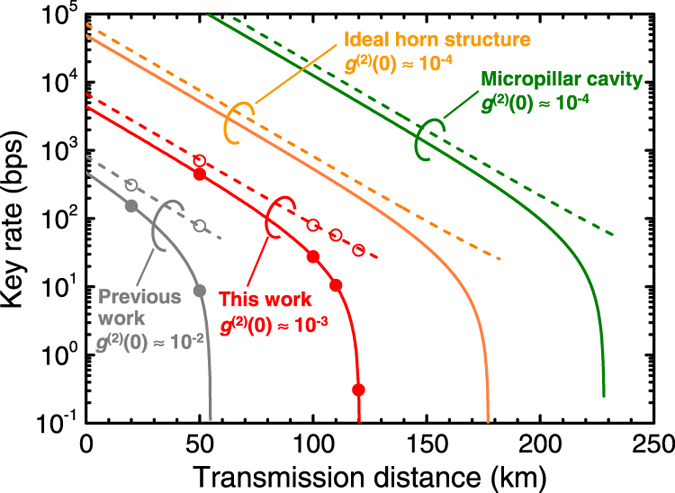
Figure 5. Key rate as a function of the transmission distance.

Measured raw key rates plotted as a function of transmission distance (red open circles and red dotted line) together with the estimated secure key rates (red closed circles and red solid line). The previous result15 (50-km-long transmission) is shown for comparison. Orange dotted (solid) and green dotted (solid) lines shows raw (secure) key rates for ideal horn structure and micropillar cavity structure, respectively (see text).
