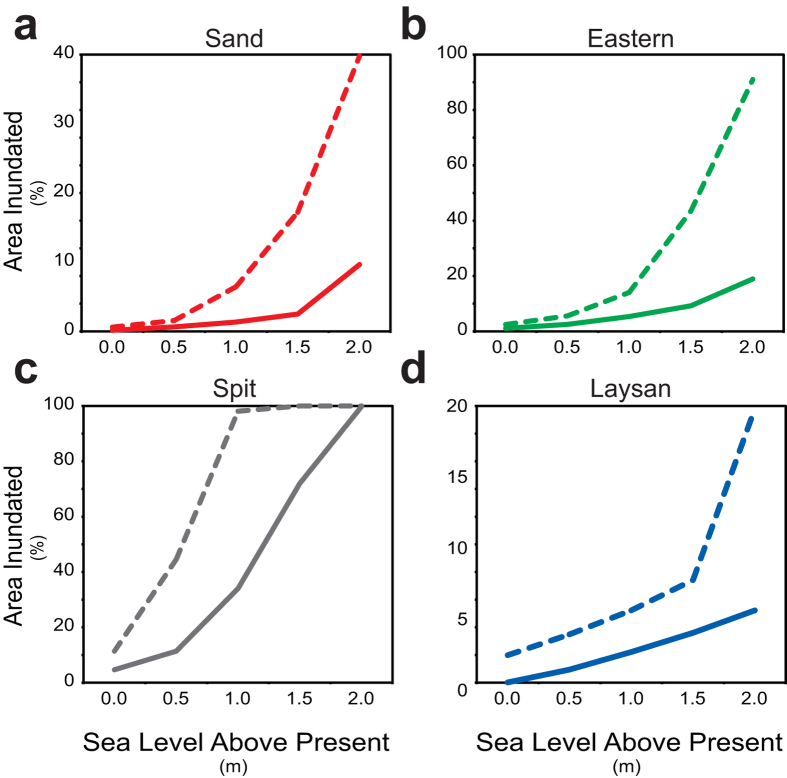
Figure 5. Differences in the percentage of land area on the four islands projected by passive modeling to be inundated (solid lines) versus that flooded by dynamic modeling (dashed lines) for the four sea-level rise scenarios relative to present sea level.
(a) Sand Island. (b) Eastern Island. (c) Spit Island. (d) Laysan Island. The dynamic models that include wave-driven water levels forecast much greater impact for a given water level, or sooner in the future, than passive models.

