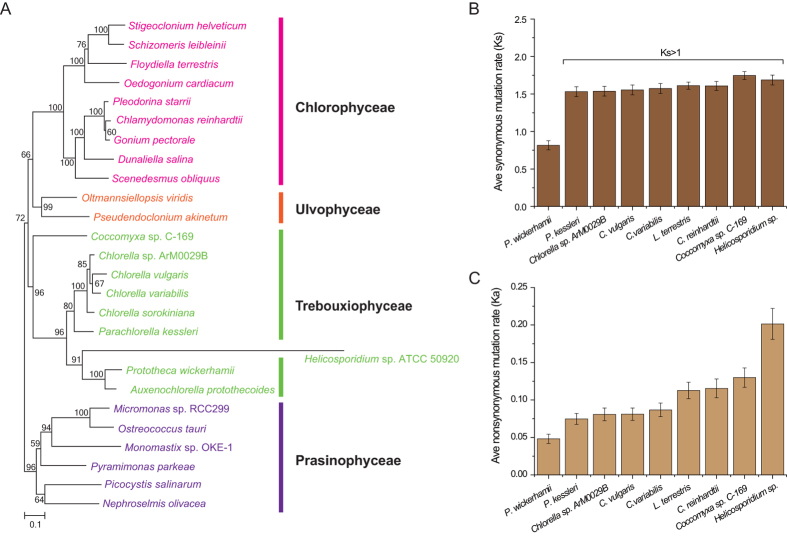
Figure 3. Phylogenetic niche of A. protothecoides as inferred from plastid gene sequences and average plastid mutation rates within the Chlorophyta.
(A) The best Maximum Likelihood phylogenetic tree computed with PHYML under the LG + G8 + I model of amino acid substitution is shown here, with prasinophytes used as outgroups. Bootstrap support for each clade is indicated on the corresponding node. (B) Average synonymous mutation rate (Ks) among A. protothecoides and nine related species. (C) Average non-synonymous mutation rate (Ka) among A. protothecoides and nine related species.

