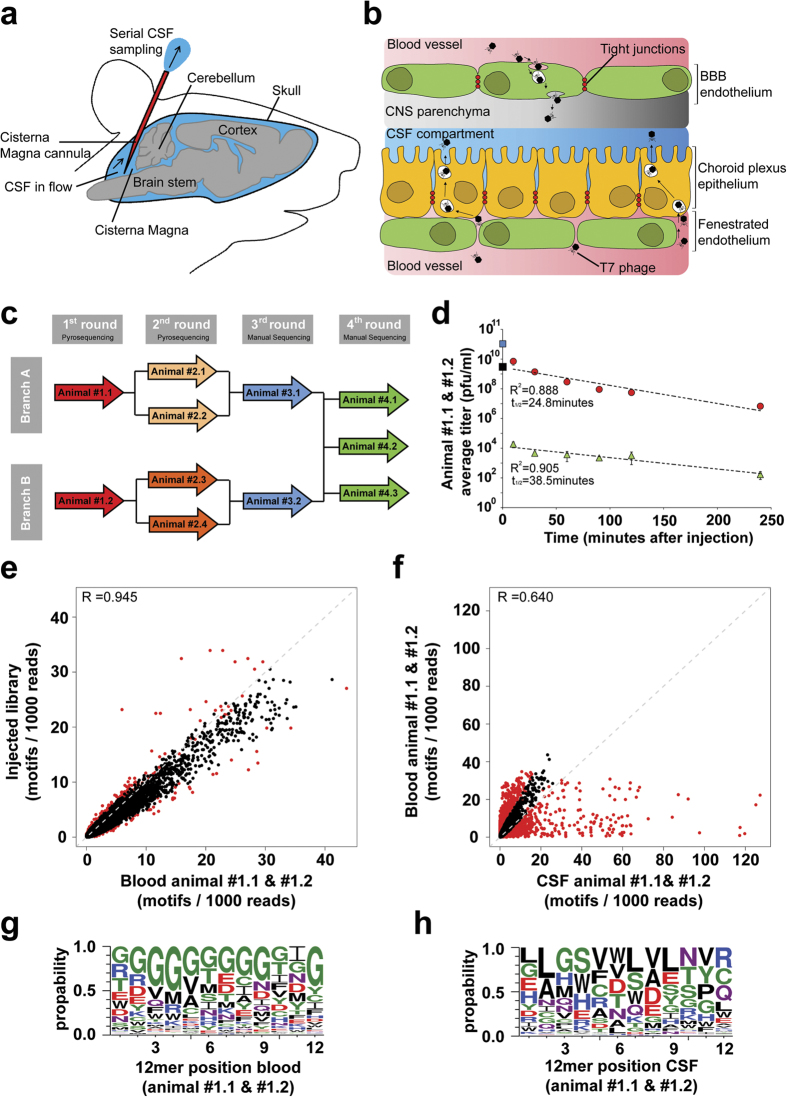
Figure 1. Functional in vivo phage-display screening for brain penetrating peptides.
(a) The methodological setup used for repeated cerebro spinal fluid (CSF) sampling from the cisterna magna. (b) Diagram showing cellular location of central nervous system (CNS) barriers and selection strategy which was used to identify peptides that cross the Blood Brain Barrier (BBB) and Blood CSF Barrier. (c) Flow chart description of the in vivo phage display screening. In every selection round phages are i.v. injected (animal ID inside arrows). Two independent selection branches (A,B) were kept separately until the 4th selection round. For the 3rd and 4th selection rounds every CSF recovered phage clone was manually sequenced. (d) Kinetics of phages recovered from blood (red circles) and CSF (green triangles) during the 1st selection round of two cannulated rats after i.v. injection of the T7 peptide library (2 × 10¹² phages/animal). Blue square represents the averaged initial blood phage concentrations calculated from the injected phage amount considering the total blood volume. The black square displays the y-axis intercept of the straight line extrapolated from the blood phage concentrations. (e,f) Relative frequencies and distribution of the motifs representing all possible overlapping tripeptides found within the peptides. Displayed are the numbers of motifs found within 1000 reads. Motifs which are significantly (p < 0.001) enriched are highlighted by red colored dots. (e) Correlation scatter plots comparing the relative tripeptide motif frequencies of the injected library vs. the blood derived phages of animals #1.1 and #1.2. (f) Correlation scatter plots comparing the relative tripeptide motif frequencies of the blood and CSF recovered phages of animals #1.1 and #1.2. (g,h) Sequence logo representation of phages enriched in the blood (g) compared to the injected library and enriched in the CSF (h) compared to blood after one round of in vivo selection in both animals. The size of the single letter code represents the frequency of occurrence of that amino acid at a given position. Green = polar, purple = neutral, blue = basic, red = acidic & black = hydrophobic amino acids. Figure 1a,b was designed and produced by Eduard Urich.

