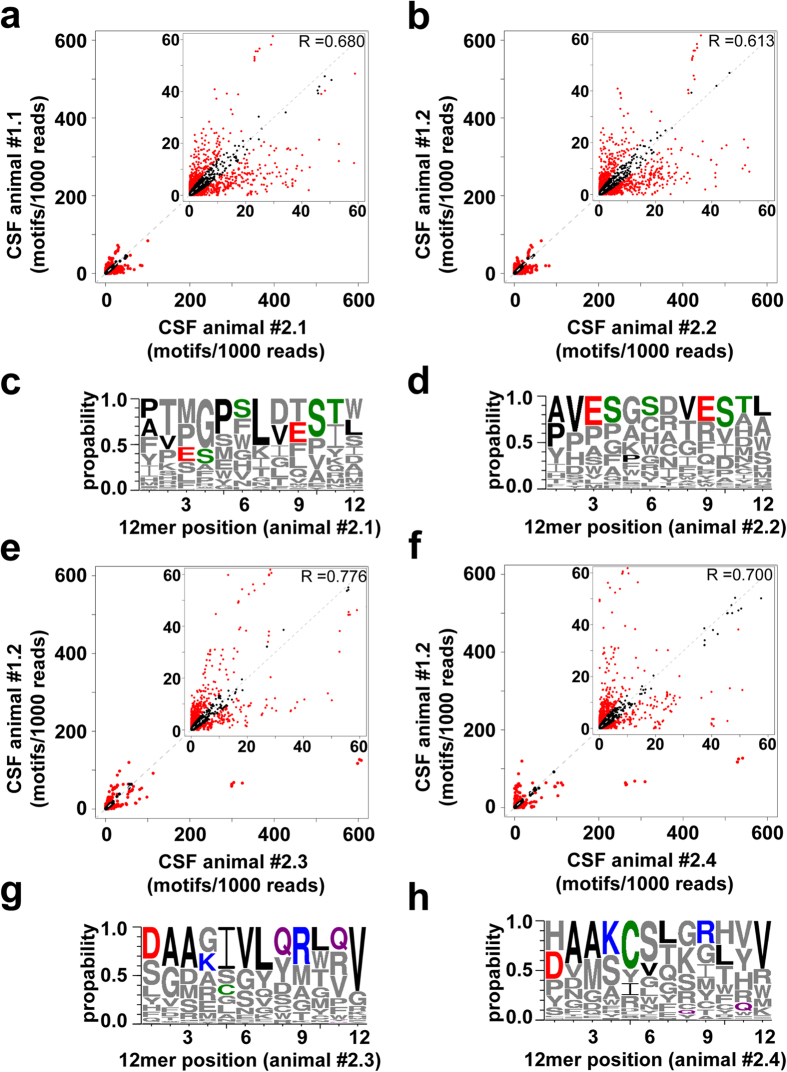
Figure 2. Motifs and peptides enrichments in the CSF over two consecutive rounds of functional in vivo phage-display selection.
All CSF recovered phages from the 1st round of each animal (animals #1.1 & #1.2) were pooled, amplified, HT sequenced and re-injected together (2 × 10¹⁰ phages/animal) into 2 CM cannulated rats each (#1.1 → #2.1 & #2.2, #1.2 → #2.3 & #2.4). (a,b,e,f) Correlation scatter plots comparing the relative tripeptide motif frequencies of all CSF recovered phages in the 1st versus the 2nd selection round. Relative frequencies and distribution of the motifs representing all possible overlapping tripeptides found within the peptides in both directions. Displayed are the numbers of motifs found within 1000 reads. Motifs which are significantly (p < 0.001) selected or de-selected in one of the compared libraries are highlighted by red colored dots. (c,d,g,h) Sequence logo representation based on all 12 amino acid long sequences enriched in the CSF in the 2nd versus the 1st round of the in vivo selection. The size of the single letter code represents the frequency of occurrence of that amino acid at a given position. For the logo representation the frequency of the CSF recovered sequences from individual animals between the two selection rounds were compared and the enriched sequences in the 2nd round are displayed: (c) #1.1–#2.1 (d) #1.1–#2.2 (g) #1.2–#2.3 and (h) #1.2–#2.4. Most enriched amino acids at a given position in (c,d) animals #2.1 and #2.2 or in (g,h) animals #2.3 and #2.4 are displayed in colors. Green = polar, purple = neutral, blue = basic, red = acidic & black = hydrophobic amino acids.

