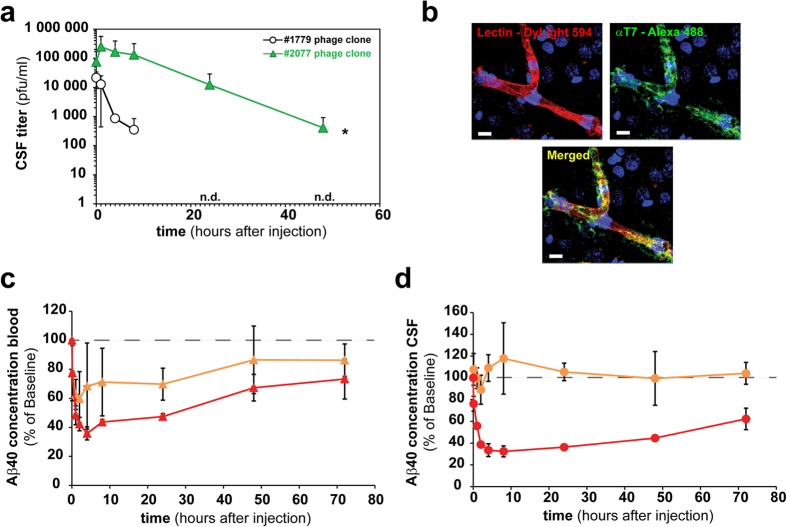
Figure 4. Lead transport peptide enhances brain BACE1 peptide inhibitory activity.
(a) Long term CSF pharmacokinetic profiles shown for the clonally injected (2 × 10¹⁰ phages/animal) T7 phage displayed #2077 (RLSSVDSDLSGC) peptide and the insert-less control phage (#1779) in at least three CM cannulated rats each. (b) Confocal microscopic image of a representative cortex microvessel in a rat i.v. injected with phage (2 × 10¹⁰ phages/animal) displaying the #2077 peptide and a vascular counterstaining (lectin). Indicated phage clones were injected into 3 rats and allowed to circulate for 1 hour before perfusion. The brain sectioned and stained with a polyclonal FITC labeled antibody against the T7 phage capsid. 10 minutes before perfusion and subsequent fixation DyLight594 labeled lectin was i.v. injected. Fluorescence images showing lectin (red) stained luminal side of the microvessel and the phage (green) in the capillary lumen and the perivascular brain tissue. Scale bar corresponds to 10 μm. (c,d) A biotinylated BACE1 inhibitory peptide alone or in combination with the biotinylated #2077 transport peptide was attached to streptavidin and subsequently i.v. injected (10 mg streptavidin/kg) in at least three CM cannulated rats each. BACE1 peptide inhibitor mediated Aβ40 reduction was measured by an Aβ1-40 ELISA in blood (red) and CSF (orange) at the indicated time points. For better visibility, a dashed line at 100% was drawn in the graphs. (c) The percentage blood (red triangles) and CSF (orange triangles) Aβ40 reduction in rats injected with streptavidin attached to the #2077 transport peptide and the BACE1 inhibitor peptide at a 3:1 ratio. (d) The percentage blood (red circles) and CSF (orange circles) Aβ40 reduction in rats injected with streptavidin attached with only BACE1 inhibitor peptides. The Aβ concentration for the control was 420 pg/ml (Std. deviation = 101 pg/ml).

