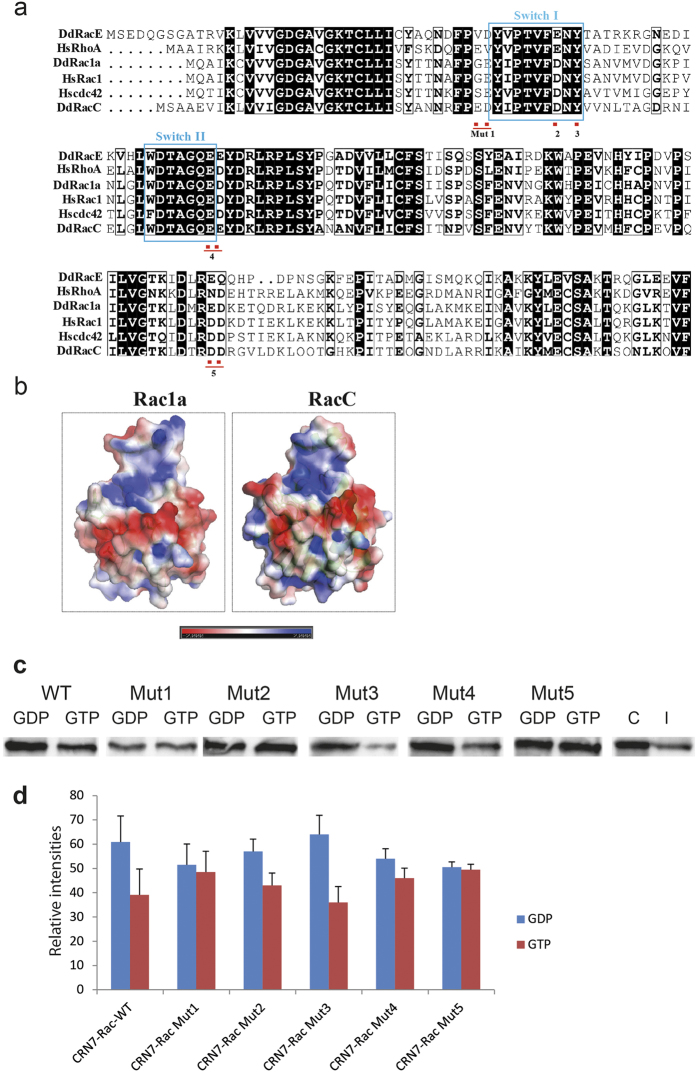
Figure 3. Mutational analysis of RacC.
(a) Alignment of various Rac proteins. The position of the mutations generated is indicated as well as of the Switch I and II regions. (b) Surface potential of D. discoideum Rac1a and RacC. The three dimensional structure of Rac1a and RacC is modeled using SWISSMODEL and the surface potential calculated using APBS plug-in in Pymol. Red, negative, blue, positive charge. (c) Interactions of RacC Mut1-5 with GFP-CRN7 WT. The RacC mutant proteins were expressed as GST fusions, bound to Glutathione-Sepharose beads, loaded with GDP or GTPγS and used to pull down GFP-CRN7 WT from cell lysates. C, represents the protein amounts in 2 × 10⁵ cells; I, aliquot of the cell lysate used in the assay. The western blots were probed with mAb K3-184-2. (d) Binding affinities of different Rac mutants to GFP-CRN7. Bar chart shows the binding of RacC wild type and mutant proteins loaded with GDP or GTPγS to GFP-CRN7. Between three and five experiments were carried out. Relative intensities are shown as arbitrary units ± SD. The differences for wild type RacC (WT), Mut2 and Mut3 were statistically significant (P < 0.02, 0.0015 and 0.01, respectively).

