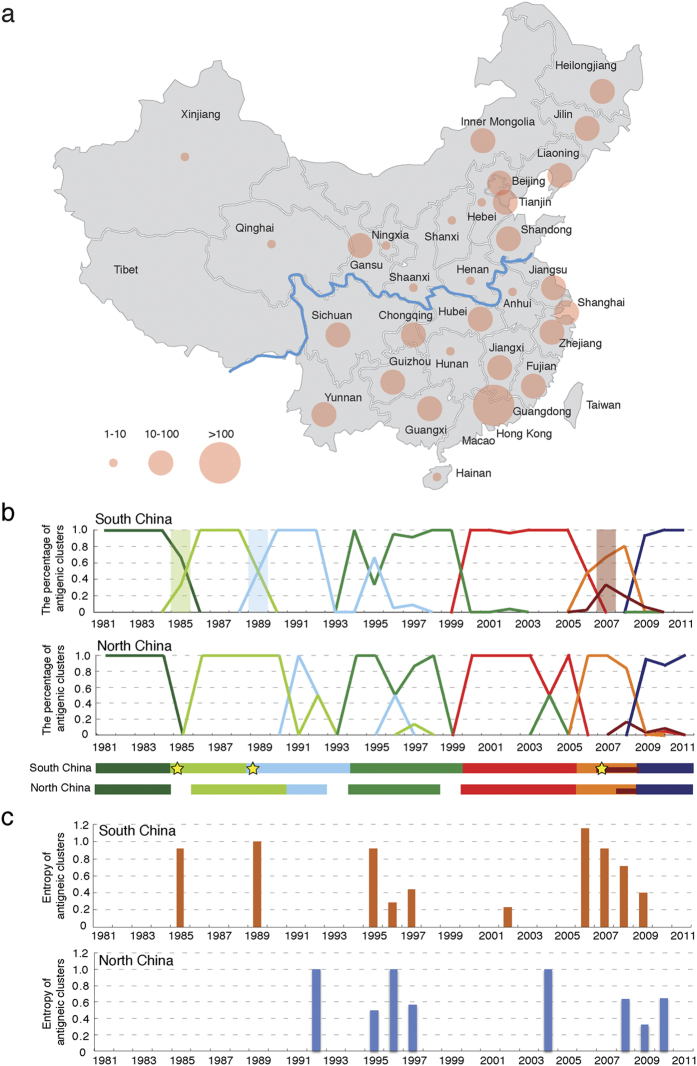
Figure 4. Antigenic patterns in South and North China.
(a) Geographic distribution of H1N1 HA sequences provided by the China CDC and obtained from a public database from 1977 to 2008. The map was reconstructed using OpenStreetMap (http://www.openstreetmap.org/) with further modification, and is for illustrative purposes only. (b) Dynamic changes in the percentage of antigenic clusters in South and North China. The underlying bar represents the circulation period of each antigenic cluster in South and North China and the earliest appearance of a new antigenic cluster is marked with a star. (c) Co-circulation of antigenic clusters in South and North China. Co-circulation was measured as the entropy of co-circulating antigenic clusters.

