
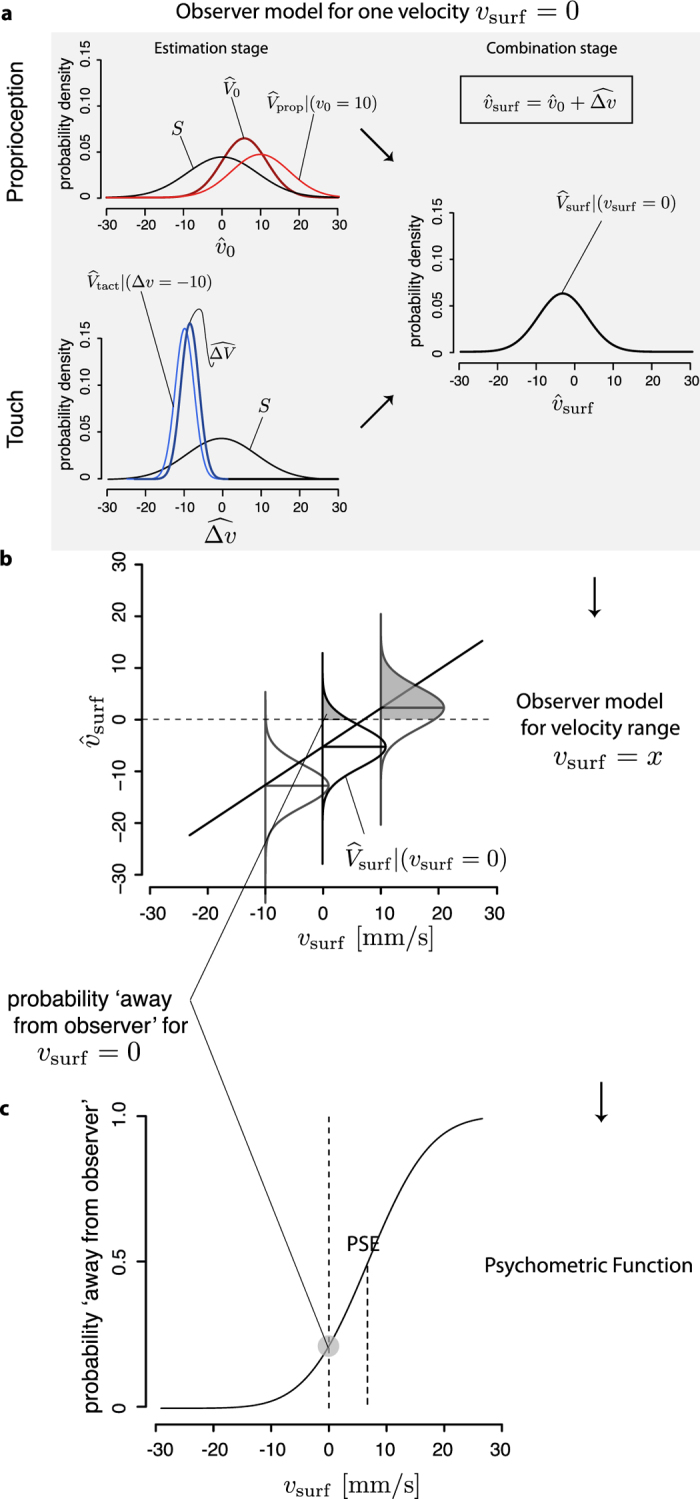
Figure 3. Bayesian Model.
 is the estimate of the initial velocity (from hand pursuit),
  is the estimate of the velocity change (from tactile slip),
  is the world-centered estimated of the surface velocity, S is the static prior. (a) The model transforms the difference in noise between proprioception and touch in a difference in accuracy (Estimation stage). The combination of the two estimates (Combination stage) generates a bias. (b) We extended the model to a continuous interval of the physical velocity, by modeling the fused estimate,
  , as a linear function of the physical velocity, vsurf, plus Gaussian noise. The parameters of the linear equation and the Gaussian noise are fully specified by the variance of the prior and of the two sensory measurements (Supplemental Data). (c) Finally, we related the observed model to the measured psychometric function defined in equation (2) by posing Yj = 1 if
  and Yj = 0 otherwise.