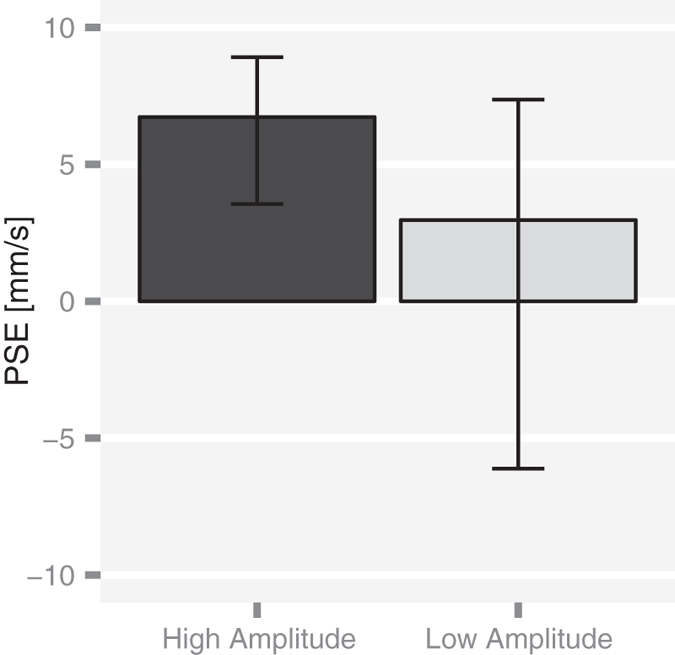
Figure 4. Experiment 2: Results.

PSE estimates (n = 10) were equal to 6.7 mm/s (95% CI from 3.9 to 8.8 mm/s) for the high oscillation amplitude and 3.0 mm/s (95% CI from −6.6 to 7.4 mm/s) for the low oscillation amplitude. Vertical bars represent the bootstrap-based 95% CIs.
