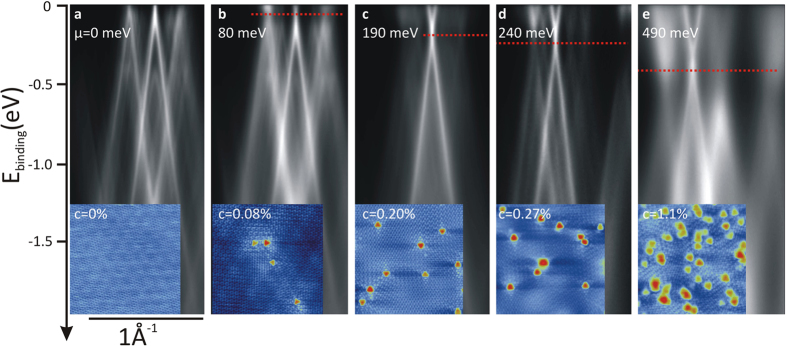
Figure 1. ARPES spectra of samples exposed for (from a to e) T = 0, 7.5, 15, 30 and 90 min.

The shift of the Fermi level (μ = EF − ED) is given on each spectrum. Insets are typical 10 × 10 nm2 STM images of the corresponding samples where the nitrogen dopants appear as red protrusions; the nitrogen concentration (c) is given on each image.
