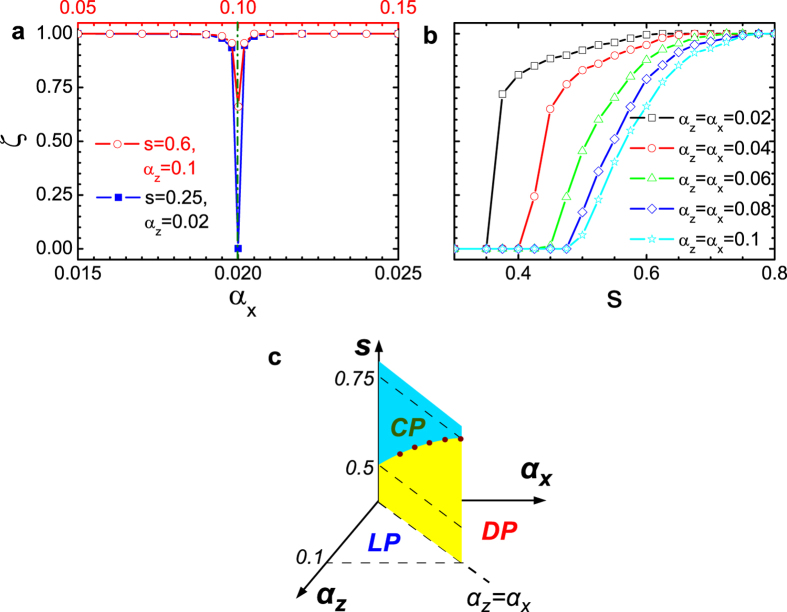
Figure 3. Order parameter ζ and phase diagram.
(a) The order parameter ζ versus αx changing from 0.015 to 0.035 for s = 0.25, αz = 0.02 and ranging from 0.05 to 0.15 for s = 0.6, αz = 0.1. The dash-dot line denotes the phase boundary. (b) ζ as a function of s for five sets of αz and αx. (c) shows the phase diagram consisting of the localized phase (LP), the delocalized phase (DP) and the critical phase (CP).

