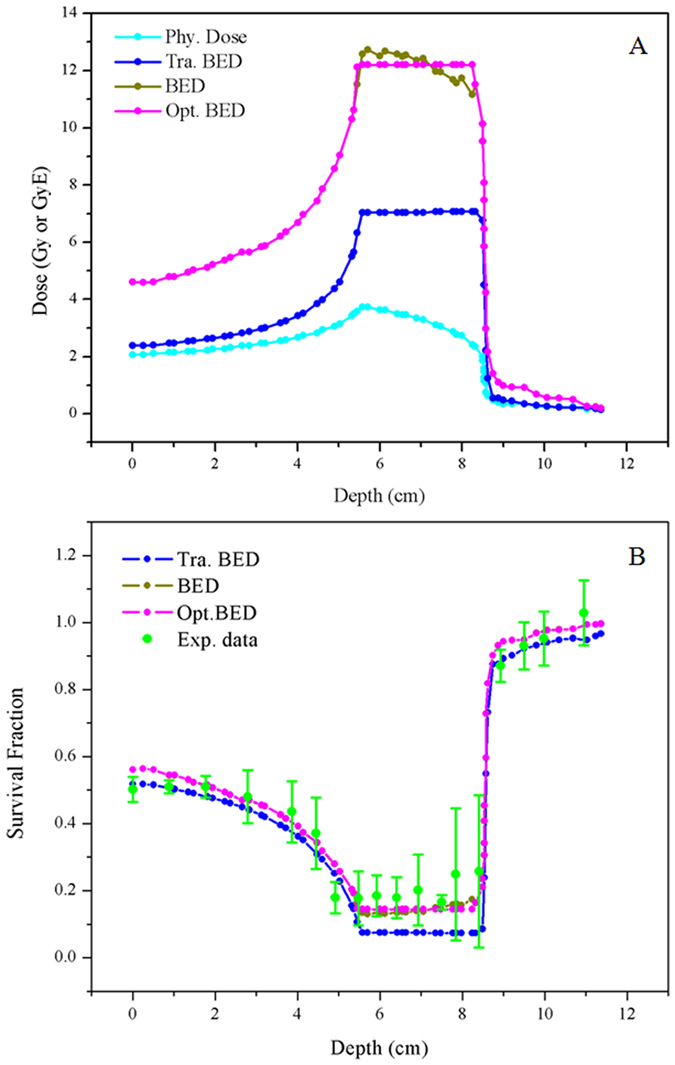
Figure 6. Calculation and optimization of biologically effective dose (BED) (A), and its corresponding cell survival fraction predicted (B) for CHO-K1 cells.

Experimental data from reference (59) is adjusted to depth-survival distribution for a 200 MeV u−1 12C beam. Phy. dose, Tra. BED, and Opt. BED in the figures represent physical dose, BED calculated by the LQ model and the GSHST model, respectively.
