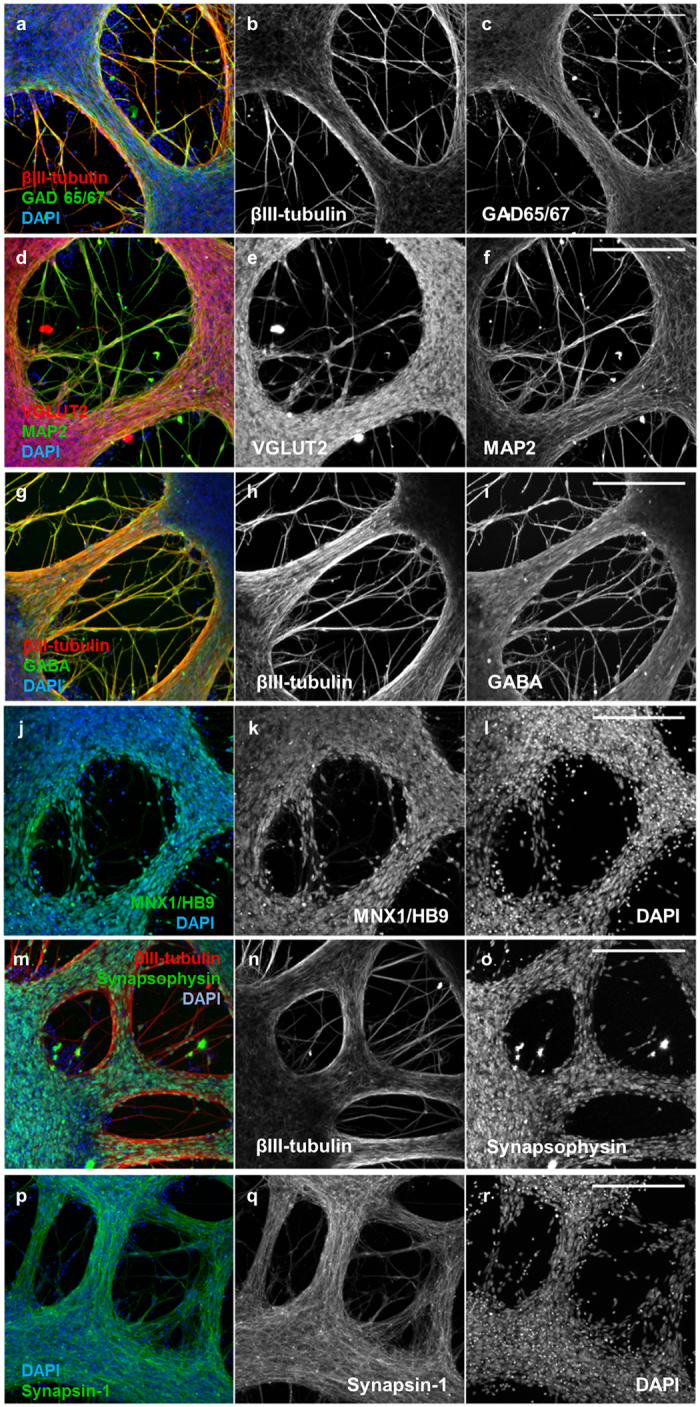
Figure 5. Neuronal markers expressed by iPSC-NSCs after differentiation and maturation on PEG hydrogels.

(a) βIII-tubulin (red), GAD 65/67 (green), and DAPI (nuclei, blue). Single channel grayscale images from (a) are shown for (b) βIII-tubulin and (c) GAD 65/67. (d) VGLUT2 (red), MAP2 (green), and DAPI (nuclei, blue). Single channel grayscale images from (d) are shown for (e) VGLUT2 and (f) MAP2. (g) βIII-tubulin (red), GABA (green), and DAPI (nuclei, blue). Single channel grayscale images from (g) are shown for (h) βIII-tubulin and (i) GABA. (j) MNX1/HB9 (green) and DAPI (nuclei, blue). Single channel grayscale images from (j) are shown for (k) MNX1/HB9 and (l) DAPI. (m) βIII-tubulin (red), Synapsophysin (green), and DAPI (nuclei, blue). Single channel grayscale images from (m) are shown for (n) βIII-tubulin and (o) Synapsophysin. (p) Synapsin-1 (green) and DAPI (nuclei, blue). Single channel grayscale images from (p) are shown for (q) Synapsin-1 and (r) DAPI. Scale Bars: 200 μm.
