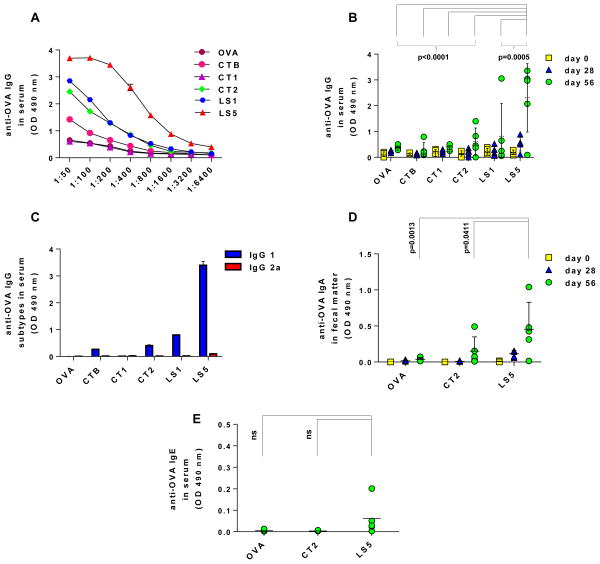
Fig 4. Systemic and mucosal immune response against ovalbumin (OVA) with lycopodium spores as the oral vaccination system.
Groups of mice (n=5 per group) were orally vaccinated on days 0 and 28 with OVA and different adjuvants. Anti-OVA IgG and IgA were determined in serum and fecal droppings, respectively. (A) Titration curve of pooled day 56 mouse serum demonstrating the high anti-OVA IgG stimulated with 5 mg LSs (LS5 group) in comparison to all other formulations. (B) Anti-OVA IgG in individual mouse serum (diluted 1:200) at different time point (days 0, 28 and 56). LS5 group shows significantly higher antibody response compared to all groups. Each symbol represents a mouse, the error bar represents standard deviation, and the horizontal line represents the mean. (C) Anti-OVA IgG subtypes in day 56 pooled serum (dilution 1:200). Error bars indicate standard deviation. (D) Anti-OVA IgA in individual mouse fecal droppings (diluted 1:5) at different time points (days 0, 28 and 56). LS5 group shows significantly higher antibody response compared to OVA alone. Each symbol represents a mouse, the error bar represents standard deviation, and the horizontal line represents the mean. (E) Anti-OVA IgE in day 56 individual mouse serum (diluted 1:25). LS5 group does not show any statistically significant difference as compared to OVA and CT2 groups. ns: not statistically significant (p>0.05).

