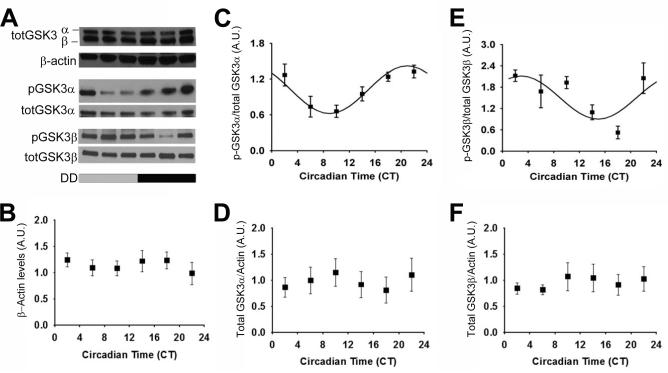
Figure 1. Rhythmic phosphorylation of GSK3 in the SCN persists in constant darkness.
(A) Representative western blots of total GSK3α/β re-blotted for beta-actin (top); p-GSK3α re-blotted for GSK3α (middle); p-GSK3β re-blotted for GSK3β (bottom). Quantification (mean ± SEM per CT bin) of (B) beta-actin levels, (C) p-GSK3α to total GSK3α ratio, (D) total GSK3α (normalized to beta-actin), (E) p-GSK3β to total GSK3β ratio, and (F) total GSK3β (normalized to beta-actin) when sampled at various times across DD. Cosinor non-linear regression: (C) R2 = 0.53, F(2, 24) = 13.73, p < 0.05, N = 27/time course; (D) R2 = 0.25, F(2, 24) = 3.96, p < 0.05; N = 27/time course; (E) R2 = 0.21, F(2, 22) = 2.91, p > 0.05; N = 26/time course.

