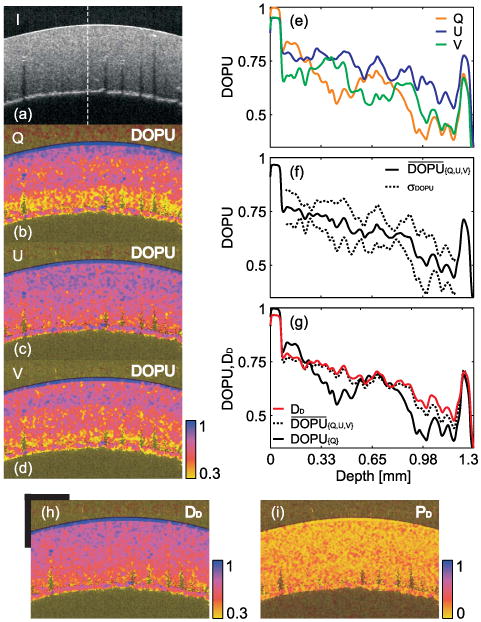
Fig. 4.

Images of a rubber phantom: (a) intensity image; (b)-(d) DOPU images for Q, U, V input polarization state; (e) DOPU cross-sections shown by white line in (a); (f) mean and standard deviation of DOPUs shown in (e); (g) comparison of DOPU, average DOPU and DD; (h), (i) depolarization index and polarization index images of the phantom. Scale bars = 1 mm.
