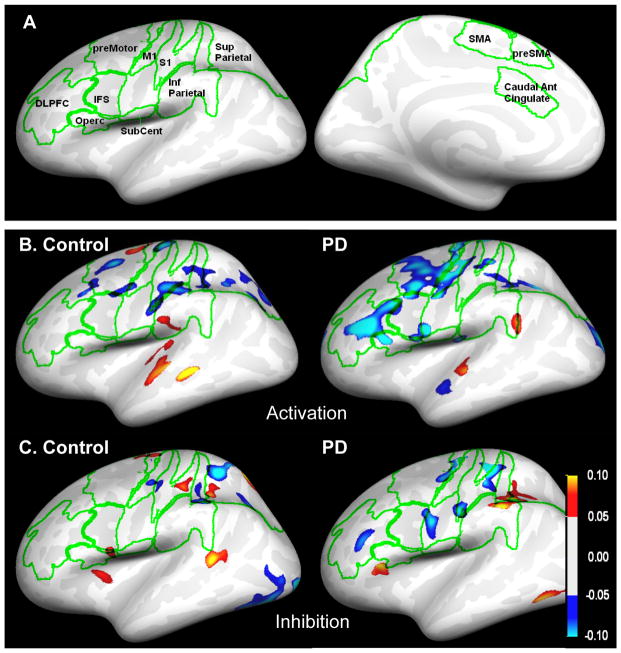
Figure 2.
A) Cortical ROI’s displayed on an unfolded brain. Green lines indicate ROI boundaries. Anterior is to the right and left, top=superior. B) Lateral view of the map for the activation condition for the BB – RB contrast. Blue = RB > BB. C) Lateral view of the map for the inhibition condition for the RR – BR contrast. Blue = BR > RR. All maps shown are BOLD % difference maps masked by a fixed-effect z statistic of 6 and a minimum cluster size of 0.2 cm2 displayed on a mean cortical surface generated from anatomical images of 60 young control subjects processed using FreeSurfer and SPM5’s MNI normalization (www.nitrc.org/projects/vamca).

