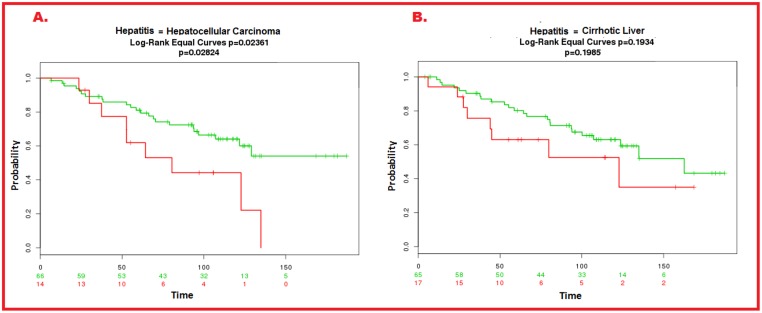
Fig 8. Relapse-free survival and ROC curve analysis.
Proposed candidate biomarkers better predicted relapse-free survival (p = 0.01191) (A) as compared to AFP (P = 0.1987) (B). With respect to the discriminating ability of proposed biomarkers, long rank equal curve showed statistically significant p-value (<0.05) for HCC p = 0.02361 while for cirrhotic liver p-value was 0.1985 (which not significant) (Fig 9A and 9B).

