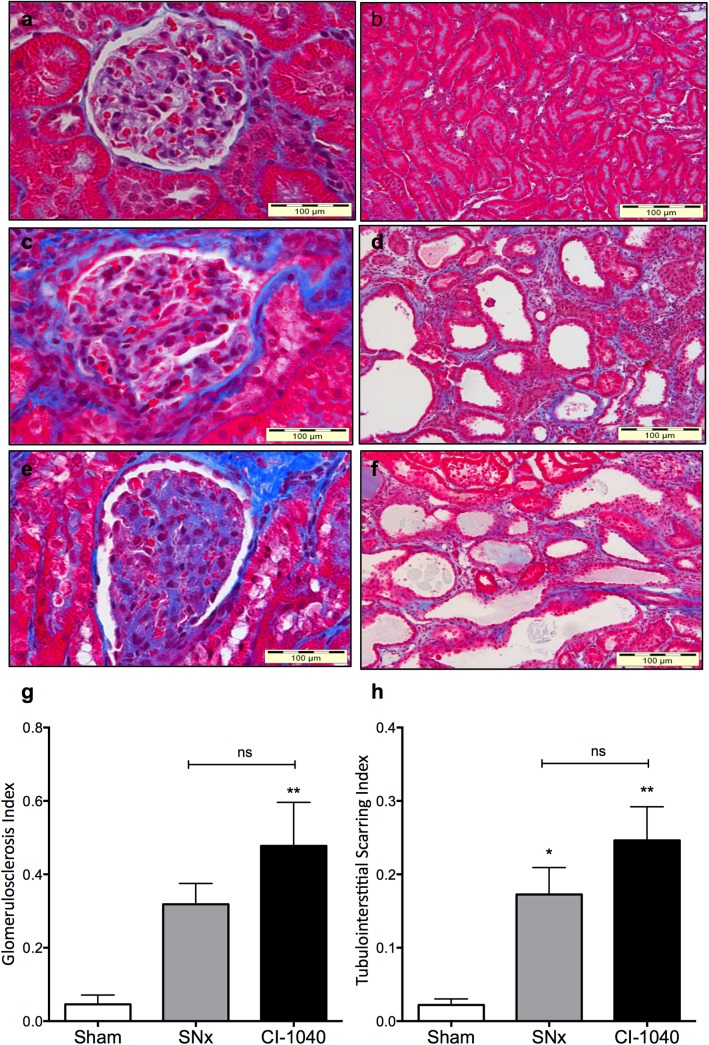
Fig 5. Glomerulosclerosis and tubulointerstitial fibrosis after treatment with CI-1040.
Representative sections of glomeruli (400x) from terminal kidney tissue (131 days) stained with Masson’s trichrome obtained from (a) sham (c) SNx and (e) SNx plus CI-1040 60mg/kg/day rats. Group data are quantified in (g). Representative sections of the tubulointerstitium (200x) from terminal kidney tissue (131 days) stained with Masson’s trichrome obtained from (b) sham (d) SNx and (f) SNx plus CI-1040 60mg/kg/day rats. Group data are quantified in (h). Bars represent mean ± SEM, n = 7–11 per group* p<0.05, ** p<0.001 vs sham controls.

