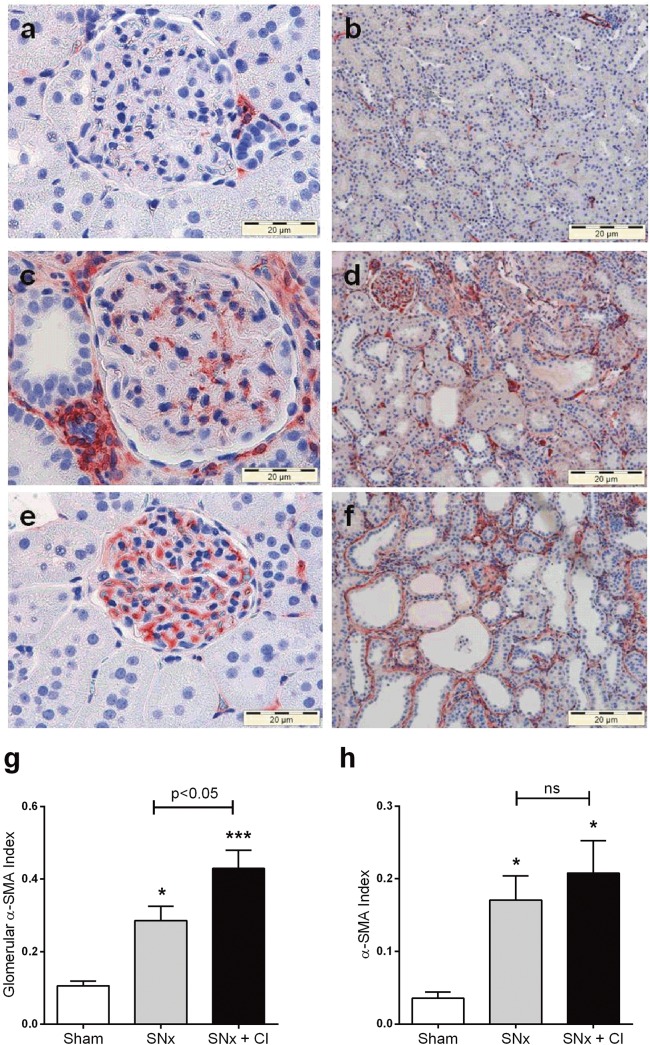
Fig 6. Myofibroblast number after treatment with CI-1040.
Myofibroblast number as indicated by α-SMA staining. Representative sections of glomeruli (400x) from terminal kidney tissue (90 day) stained with α-SMA obtained from (a) sham (c) SNx and (e) SNx plus CI-1040 60mg/kg/day rats. Group data are quantified in (g). Representative sections of the tubulointerstitium (200x) from terminal kidney tissue (90 day) stained with α-SMA obtained from (b) sham (d) SNx and (f) SNx plus CI-1040 60mg/kg/day rats. Group data are quantified in (h). Bars represent mean ± SEM, n = 7–11 per group. * p<0.05, *** p<0.001 vs sham controls.

