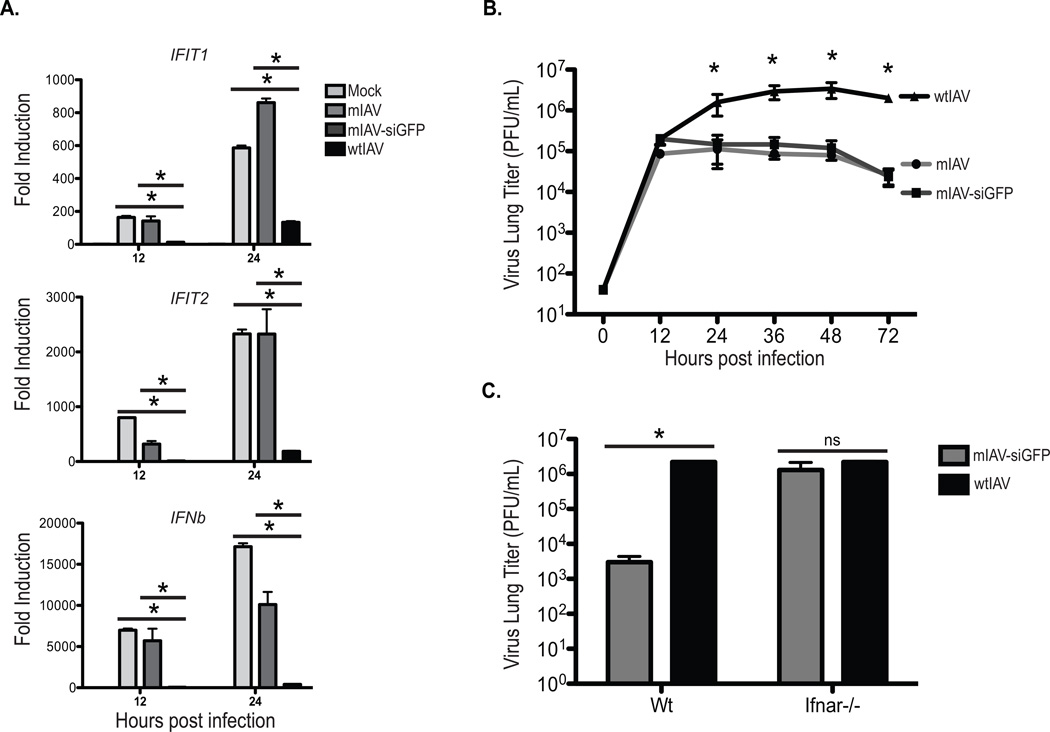
Figure 1. Virus-encoded siRNAs do not impose further attenuation on mIAV.
(A) Quantitative RT-PCR (qPCR) of IFIT1, IFIT2, and IFNb in A549 cells either mock treated or infected (MOI=0.1) with mIAV, mIAV-siGFP, or wtIAV. Error bars, SD, *p<0.05.
(B) Multi-cycle growth curves in A549s infected (MOI=0.01) with mIAV, mIAV-siGFP, or wtIAV. Error bars, SD, *p<0.05.
(C) Virus lung titers of wild type or Ifnar1−/− B6 mice infected with either the mIAV-siGFP, or wtIAV viruses. Mice were infected with 1 × 10⁶ pfu of each virus and lungs were harvested 24 hpi. Error bars, SD, *p<0.05.

