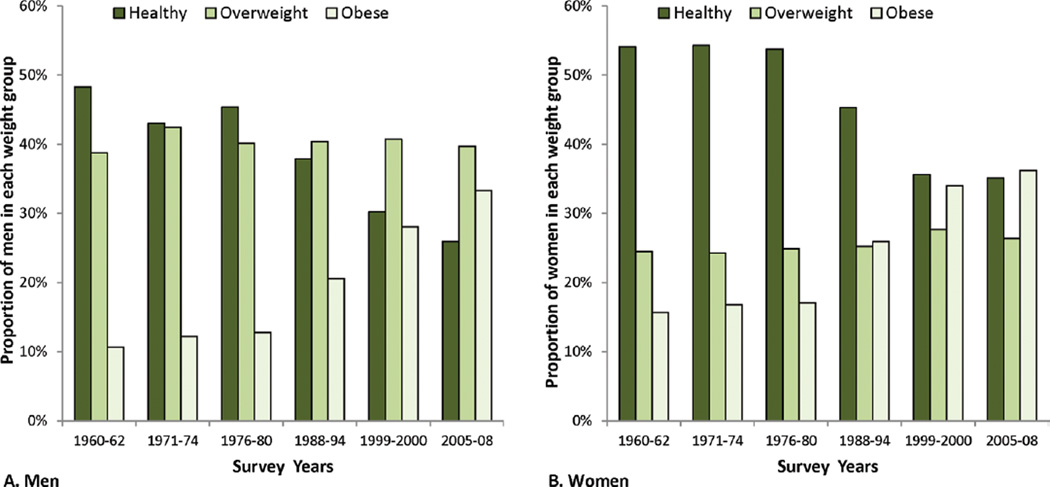
Figure 1.
The distribution of body mass index (BMI) is illustrated over time for adult (ages 20–74 years) (A) men and (B) women by sex and survey year: United States, 1960 to 2008. Body mass index (BMI) is calculated as weight in kilograms divided by height in meters squared. BMI in the range 18.5–24.9 kg/m2 is considered healthy weight (dark green bars), BMI in the range 25–29.9 kg/m2 is considered overweight (medium green bars) and BMI ≥ 30 kg/m2 is considered obese (light green bars). Prevalence was age-adjusted to the 2000 US standard population using five age groups: 20–34 years, 35–44 years, 45–54 years, 55–64 years, and 65–74 years. Data are from the National Health and Nutrition Examination Survey except data for 1960–1962 which are from the National Health Examination Survey. Source: National Center for Health Statistics. Health, United States, 2010: With Special Feature on Death and Dying (Table 71). Hyattsville, MD. 2011.29

