Fig. 5.

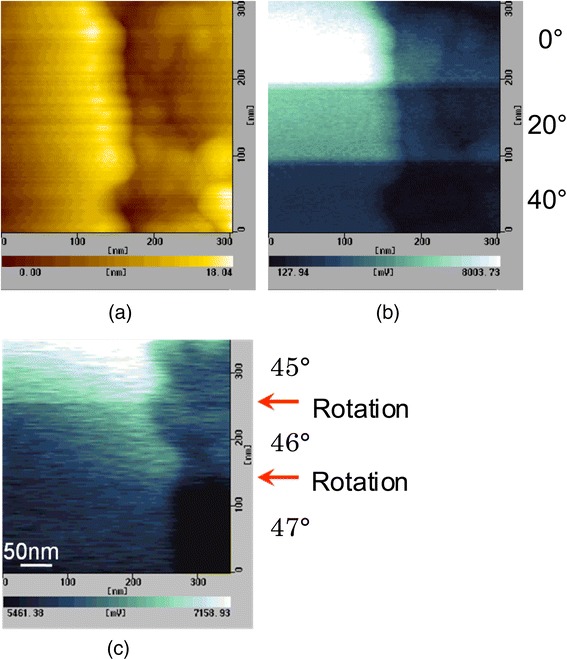
a An AFM image and b, c SNOM images of a Cr pattern on quart substrate measured with various angles of the analyzer shown in the right side of the images

a An AFM image and b, c SNOM images of a Cr pattern on quart substrate measured with various angles of the analyzer shown in the right side of the images