
Fig. 9.
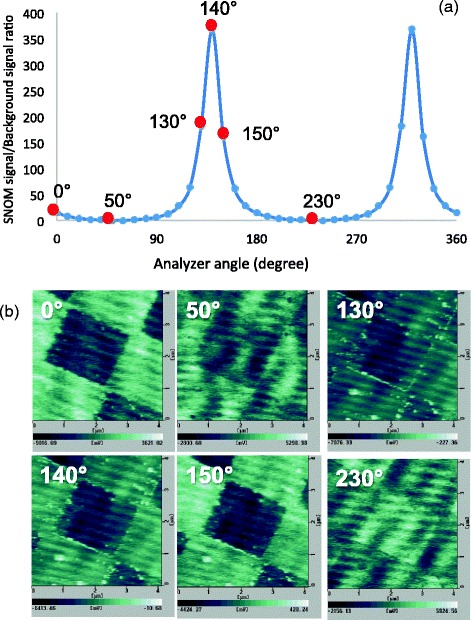
a Ratios of SNOM signals to background signals plotted as a function of the analyzer, and b SNOM images of a Cr pattern on quart substrate measured with various angles of analyzer indicated in (a), 0°, 50°, 130°, 140°, 150°, and 230°
Official websites use .gov
A
.gov website belongs to an official
government organization in the United States.
Secure .gov websites use HTTPS
A lock (
) or https:// means you've safely
connected to the .gov website. Share sensitive
information only on official, secure websites.
a Ratios of SNOM signals to background signals plotted as a function of the analyzer, and b SNOM images of a Cr pattern on quart substrate measured with various angles of analyzer indicated in (a), 0°, 50°, 130°, 140°, 150°, and 230°