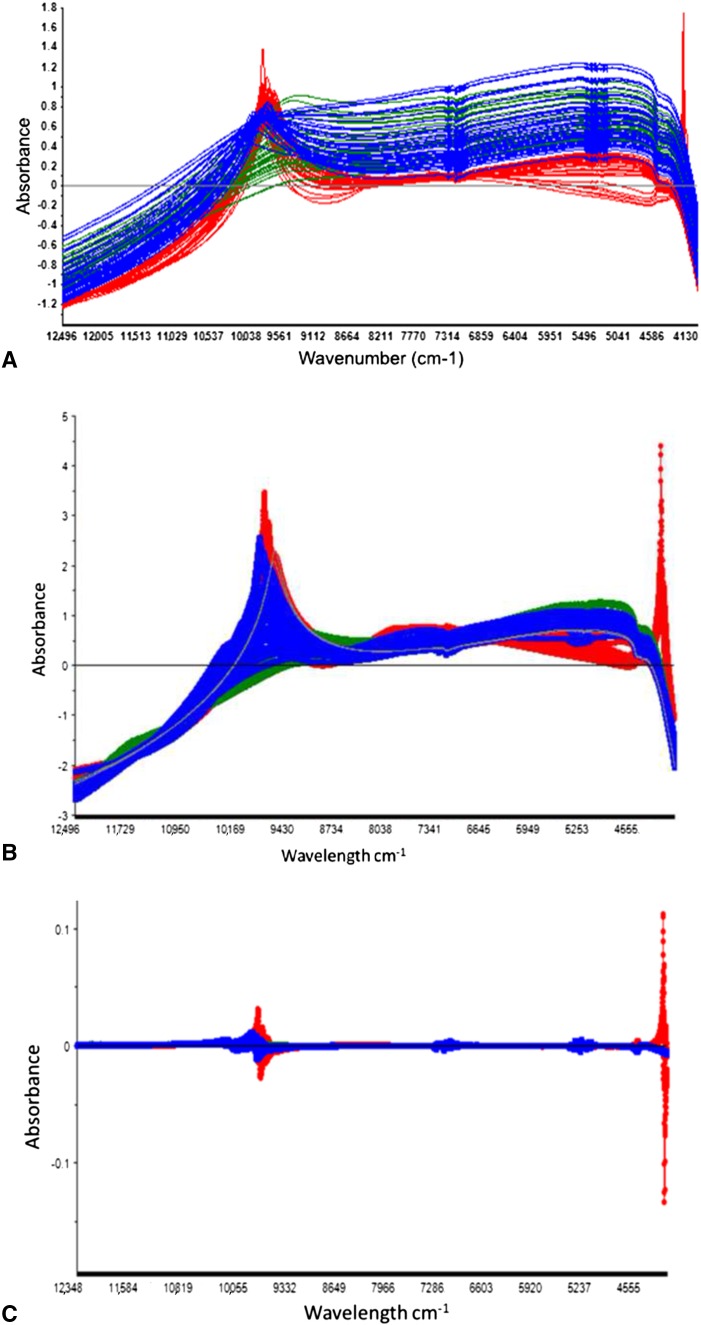
Fig. 2A–D.
The raw spectra of the three classes of bacteria we used for development of calibrations are shown. (A) P aeruginosa (red) has higher absorption at 10,000 to 9245 cm−1. (B) First-derivative preprocessed spectra show broad absorbance ranges and separation is difficult owing to lack of distinct peaks. (C) Standard normal variant preprocessed data show improved distinction between the P aeruginosa and the gram-positive species. (D) Standard normal variant + first-derivative preprocessed data have increasingly distinct characteristics to the gram-positive species. Red = P aeruginosa. Blue = S aureus. Green = S epidermidis.

