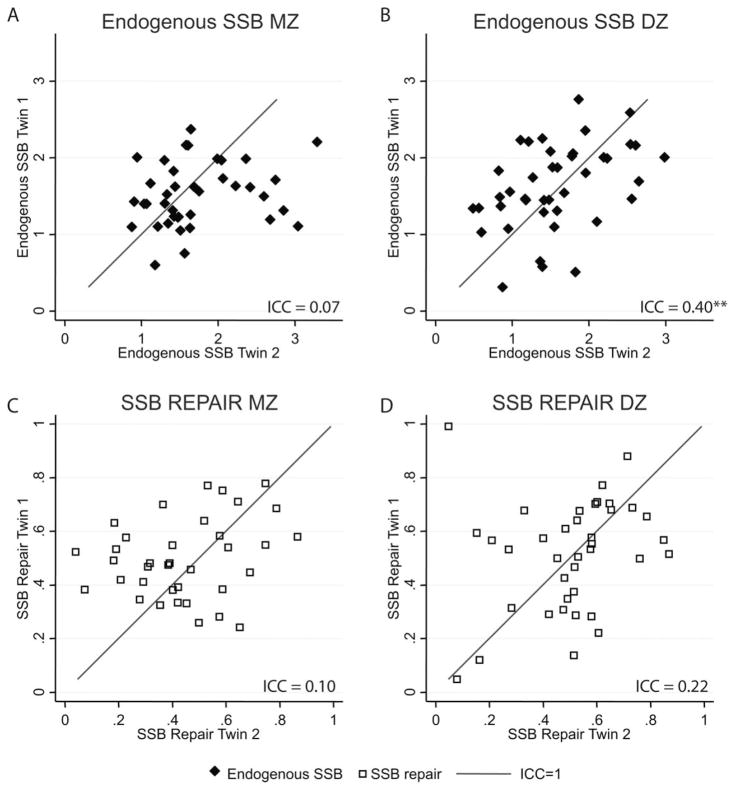
Fig. 1.
Correlation plots for endogenous SSB (solid diamonds) and SSB repair capacity (open squares) stratified by zygosity. The level of endogenous SSB was normalized to an internal control. The specific DNA-strand break repair data for one twin of a pair (Twin 1) was plotted against the co-twin (Twin 2); hence, one symbol represents a twin pair. The lines represent perfect correlation. Interclass coefficients (ICC) are presented for each plot (significance level: *P <0.05; **P <0.01). A: endogenous SSB MZ; B: endogenous SSB DZ; C, SSB repair MZ; D, SSB repair DZ.

