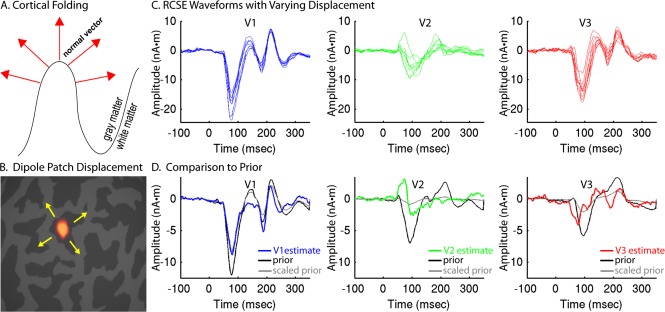
Figure 3.

RCSE dipole optimization constrained by group‐RCSE prior. A: Schematic depiction of the relationship between cortical folding, dipole location, and predicted dipole orientation. B: Dipole patches were displaced across the cortical surface in search of better fitting locations. C: For an individual subject, cortical displacement of dipole patches can result in a variety of V1, V2, and V3 RCSE waveforms, some of which provide a better fit to the measured MEG data. D: To constrain dipole optimization, waveform estimates (blue, green, or red traces) are compared with the prior estimate derived from group‐constrained RCSE (black traces) that have been scaled in amplitude (gray traces) to best match the estimate at each iteration. RCSE waveforms shown were derived from responses to high contrast (95%) stimuli. [Color figure can be viewed in the online issue, which is available at http://wileyonlinelibrary.com.]
