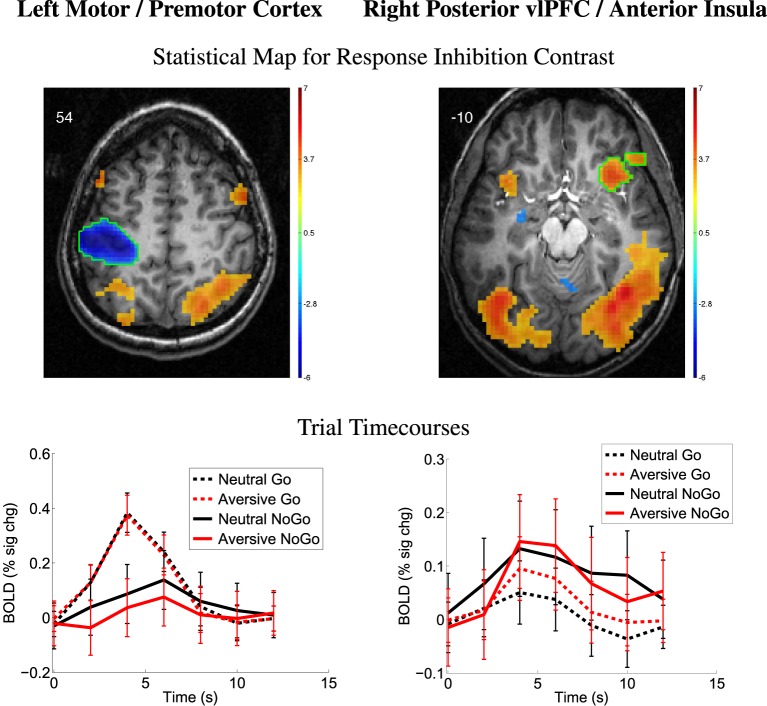
Figure 3.
Top row: Statistical t-map for response inhibition contrast (NoGo − Go, collapsed across distractor type). Red and blue regions, respectively, exhibited larger contrast magnitudes for NoGo and Go trials. All results p < 0.05 (corrected for multiple comparisons). Color bar indicates t-value scaling. Slice Z-coordinate in MNI space shown in upper-left. Axial images' left side corresponds to left side of brain. vlPFC: ventrolateral prefrontal cortex. Second row: Mean deconvolved timecourses for four trial types for regions outlined in green in first row. Error bars denote mean across all participants' standard error of mean activation time course values.

