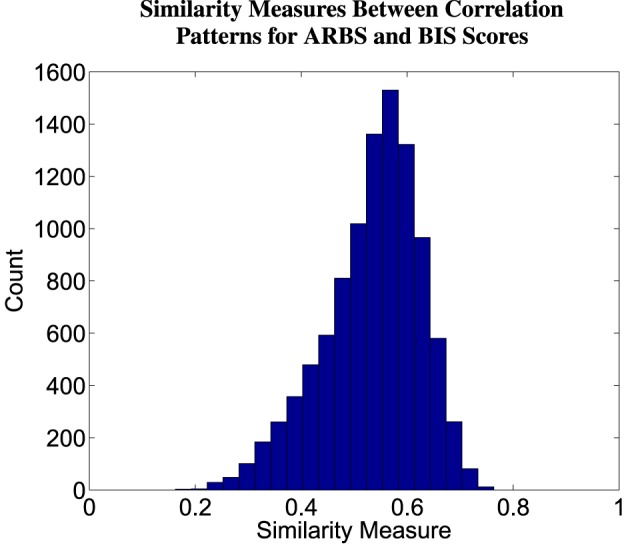
Figure 6.

Histogram of similarity measures between correlation patterns for ARBS and BIS scores. A correlation pattern captures the relationship between an instrument (ARBS or BIS scores) and fMRI contrast values. See Section 2.7 for details of correlation pattern and similarity measure computation. Values were computed from 10,000 iterations of bootstrap sampling.
