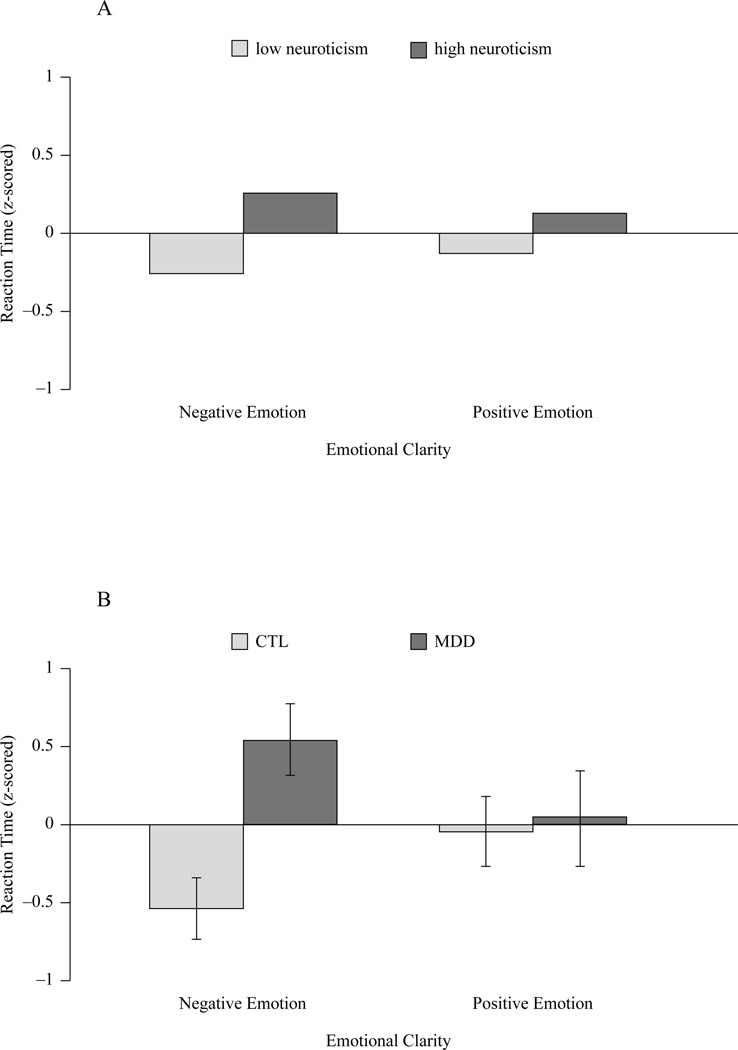
Figure 1.
Aggregated within-person reaction times (prompt level, z-scored). Panel A presents results from Study 1, separately for low (-1 SD below mean) versus high (+1 SD above the mean) levels of neuroticism. Panel B presents results from Study 2 by depression group (CTL = healthy control group; MDD = Major Depressive Disorder group), with error bars representing 95% confidence intervals.

