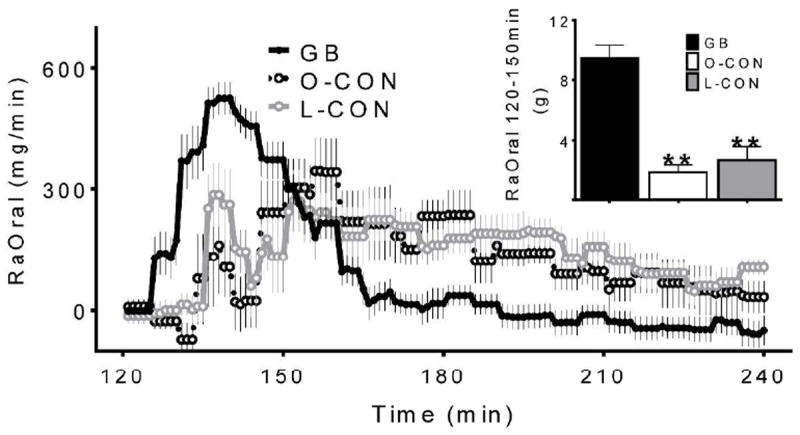
Figure 5.

Systemic appearance of ingested glucose during hyperinsulinemic clamp in GB subjects (solid black line, black bar), matched obese controls (dashed black line, white bar), and lean controls (grey line, grey bar). Corresponding postprandial AUC(120-150min) shown in inset; ** (p<0.01) compared to the GB subjects
