
Fig. 10.
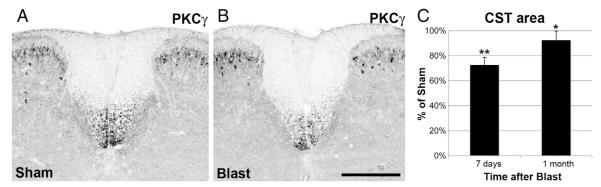
Degeneration of CST axons. A, B) Transverse sections of the spinal cord at the T13-L1 level immunostained for PKCγ to visualize the dCST. Within the spinal cord, PKCγ expression is restricted to dCST axons and to a subpopulation of lamina II dorsal horn interneurons; the latter provides a useful positive control for the immunostaining. A is from a sham mouse. B, from one of its littermates at 7 days after blast, shows less intense immunostaining, indicating the loss of dCST axons. The optical density scale has been inverted so that the fluorescent staining appears black and background has been adjusted to make the gray matter visible, to provide orientation. Scale bar = 100 μm. C) Histograms showing the area of PKCγ immunostaining in the dCST above threshold, expressed as percentage of that for sham mice. Average value for blasted mice at 7 days after blast is significantly less than that of their sham littermates. Area of the dCST at 1 month post-blast is more than at 7 days post-blast, but is still significantly less than that of the sham littermates. Brackets indicate standard errors. *p < 0.05; **p < 0.005.