Fig. 2.
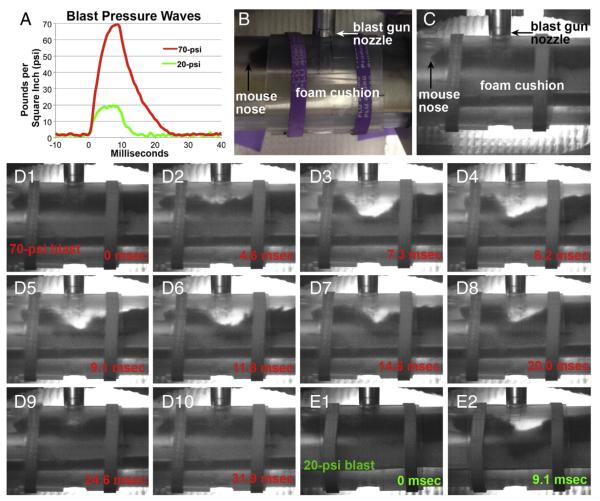
Blast pressure waves and video recordings. A) Pressure waves for two blast amplitudes: 70 psi (average of 4 blasts) used to create axonal injury and 20 psi (average of 2 blasts) used to examine the contribution of dorsiflexion to axonal injury. B) Photograph of mouse in holder, as in Fig. 1F, now oriented to approximate the view seen in the high-speed video recordings. C) Still image, taken before blast, from the video recording of the mouse shown in panels D1–10. The images are ‘noisier’ than that in B, because of the very short exposure times (<1 ms) of the video camera. Differences in camera angles and the positioning of the rubber bands account for additional slight differences between B and C. The mouse dorsum is ~1 cm from the nozzle of the blast gun. D) Still images from a video recording of a mouse subjected to a 70-psi blast, showing dorsiflexion of its torso. The times indicated start with the first clear movement of the fur. Maximal deflection of 1.1 cm is seen in D3. Successive images show that the site of maximum deflection changes as the pressure wave propagates along the mouse’s body and that the mouse’s head and the caudal part of its body lift up, to accommodate the bending of its torso. E) Still images from a video recording of a mouse subjected to a 20-psi blast, showing a maximal deflection of 0.66 cm.

